Automatically generated plots
In addition to providing structured output to allow users to create their own plots, Enrich2 produces default visualizations for each analysis. Experiment, Selection, and SeqLib objects each have their own directory inside “Results/plots/”. Plots are saved in PDF format, and many of the files contain multiple pages.
Experiment plots
Sequence-function map
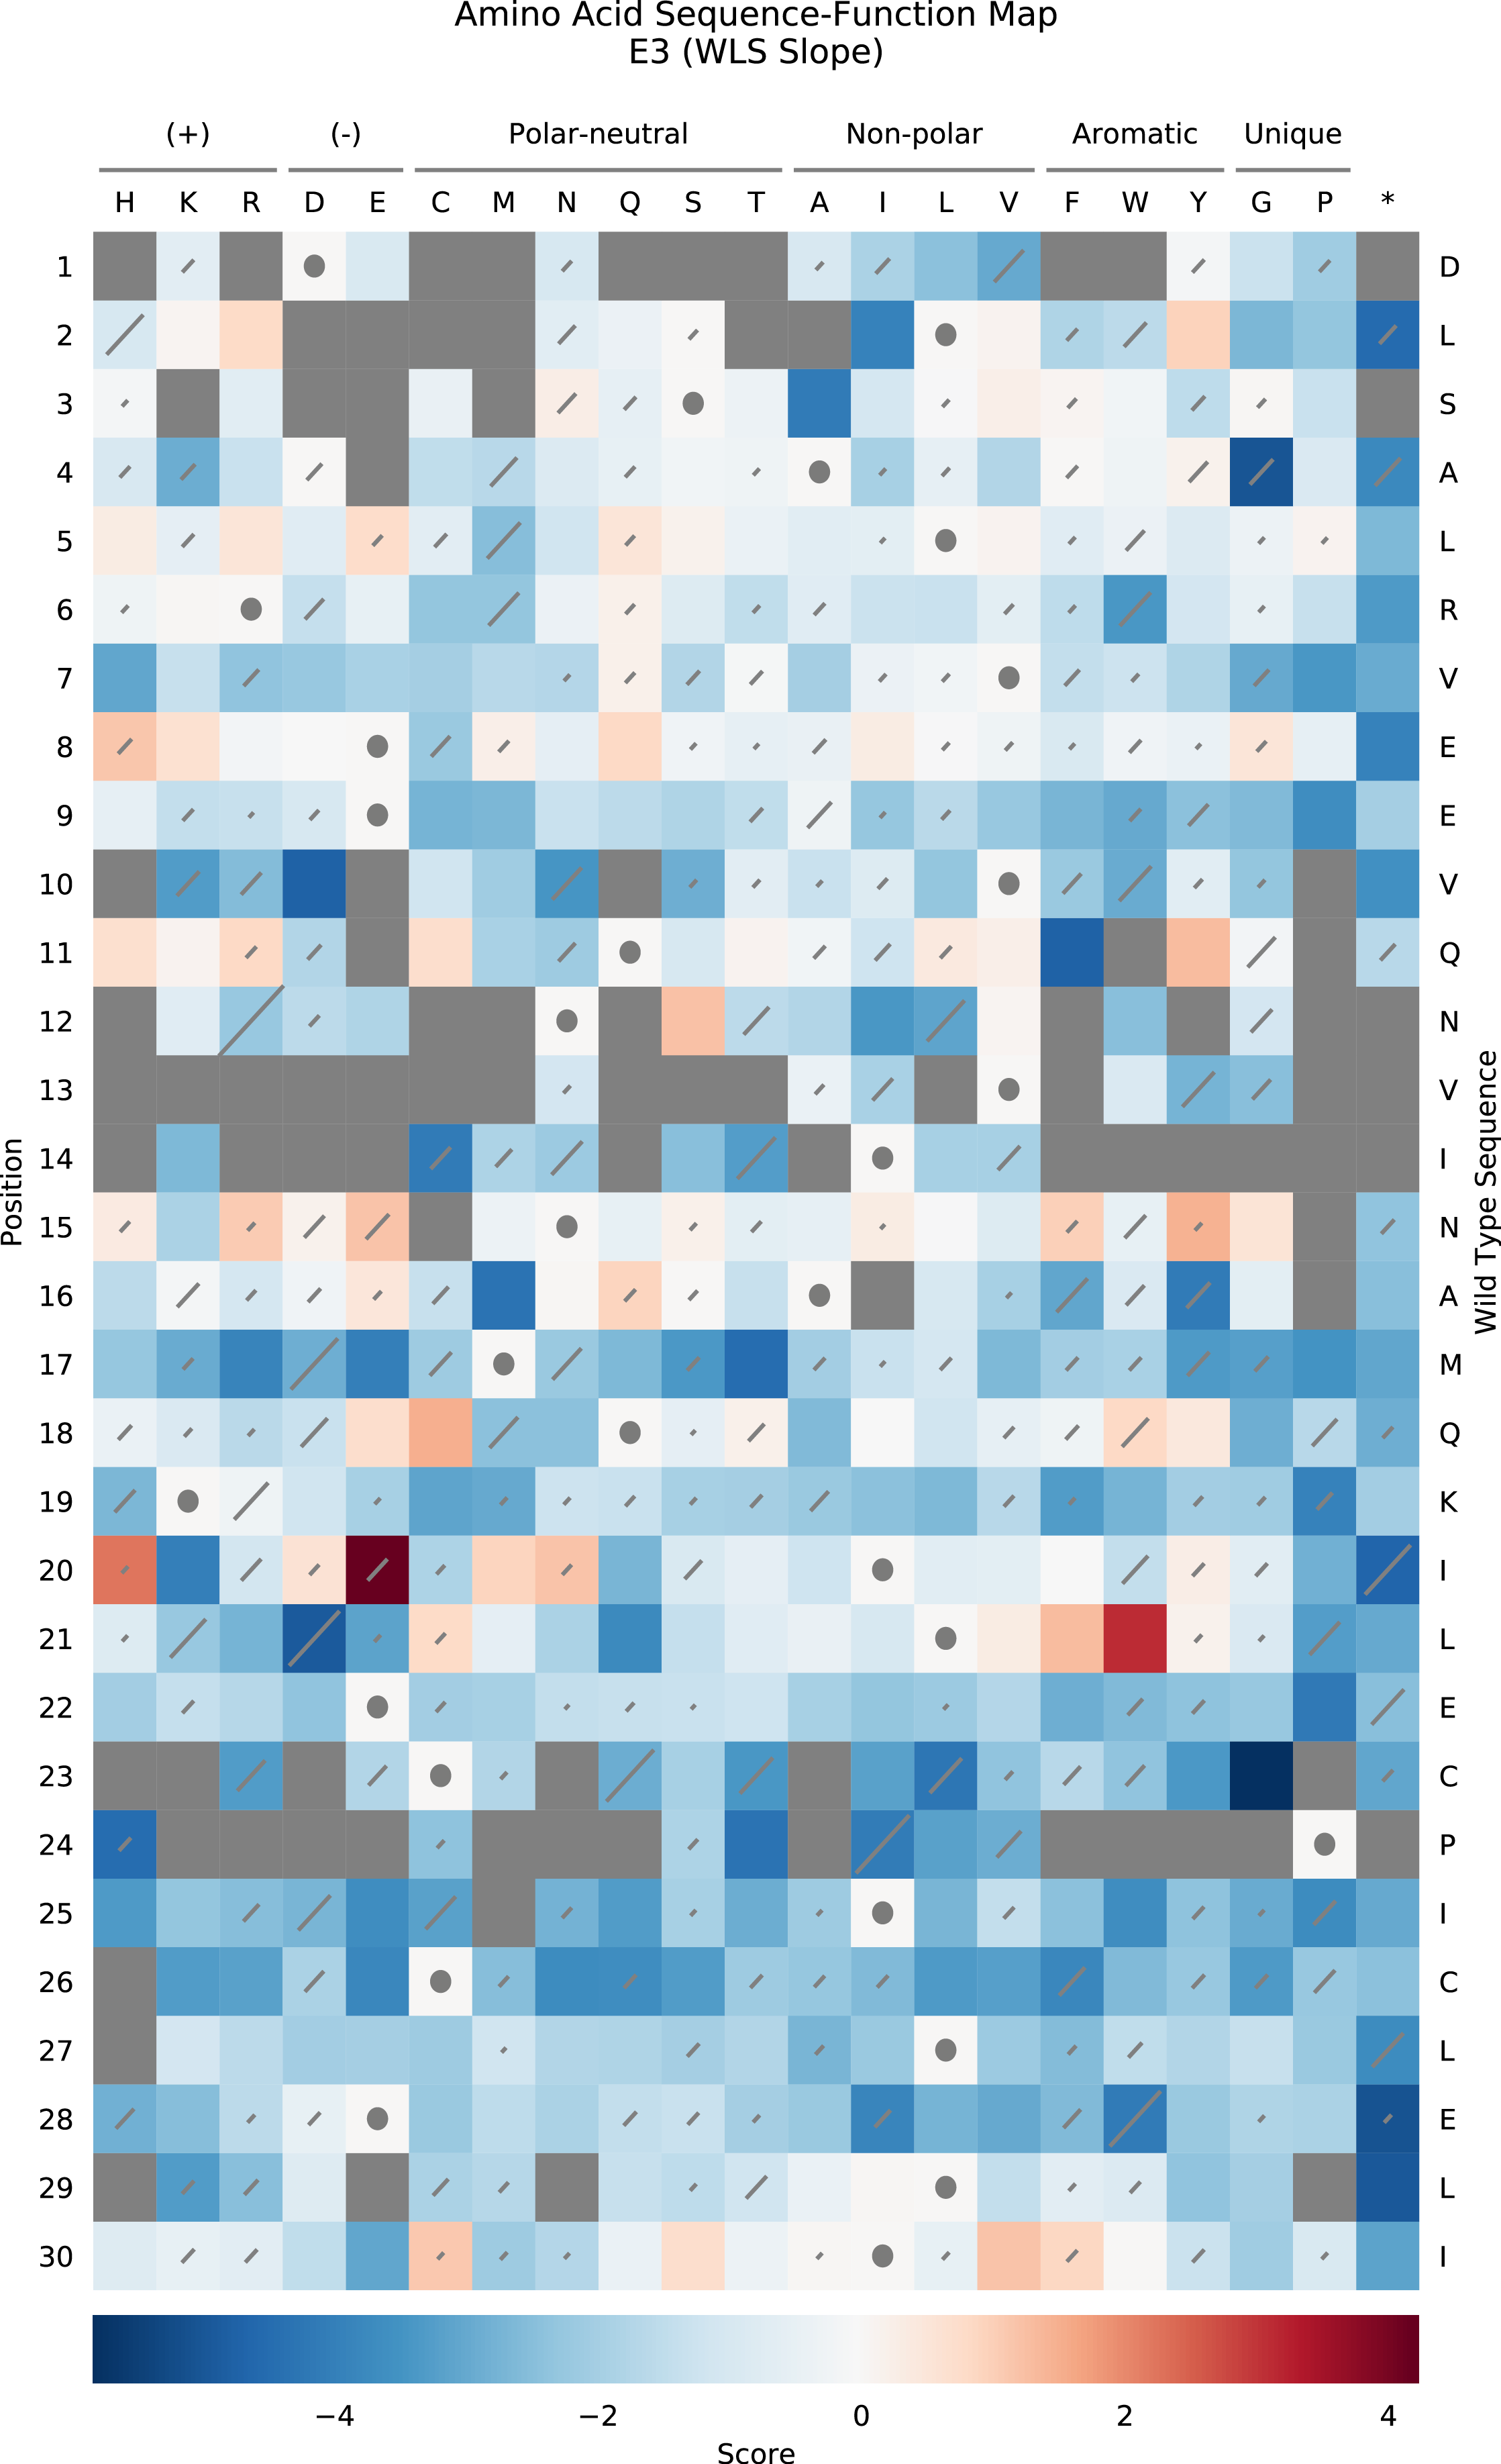
Visualization of scores and standard errors for single changes from wild type. Separate protein- and nucleotide-level sequence-function maps are generated.
Cell color indicates the score for the single change (row) at the given position (column). Positive scores (in red) indicate better performance in the assay, and negative scores (in blue) indicate worse performance. Grey squares denote changes that were not measured. Diagonal lines in each cell represent the standard error for the score, and are scaled such that the highest standard error on the plot covers the entire diagonal. Standard errors that are less than 2% of this maximum value are not plotted. Cells containing circles have the wild type residue at that position.
Custom amino acid ordering and groups can be specified by running Enrich2 in command line mode and using the
--sfmap-aa-fileoption. Each line of the file begins with an optional label followed by a single tab character and then a comma-separated list of single-letter amino acid codes. All amino acid codes must be present exactly once.The following amino acid grouping files are provided:
Default (
click to download)This grouping is used when no file is specified. Reference
(+)	H,K,R
(-)	D,E
Polar-neutral	C,M,N,Q,S,T
Non-polar	A,I,L,V
Aromatic	F,W,Y
Unique	G,P
	*
Helical Propensity (
click to download)High helical propensity A,L,R,M,K,Q,E,I,W Low helical propensity S,Y,F,V,H,N,T,C,E Disruptive G,P *
Selection plots
Sequence-function map
As above.
Diversity map
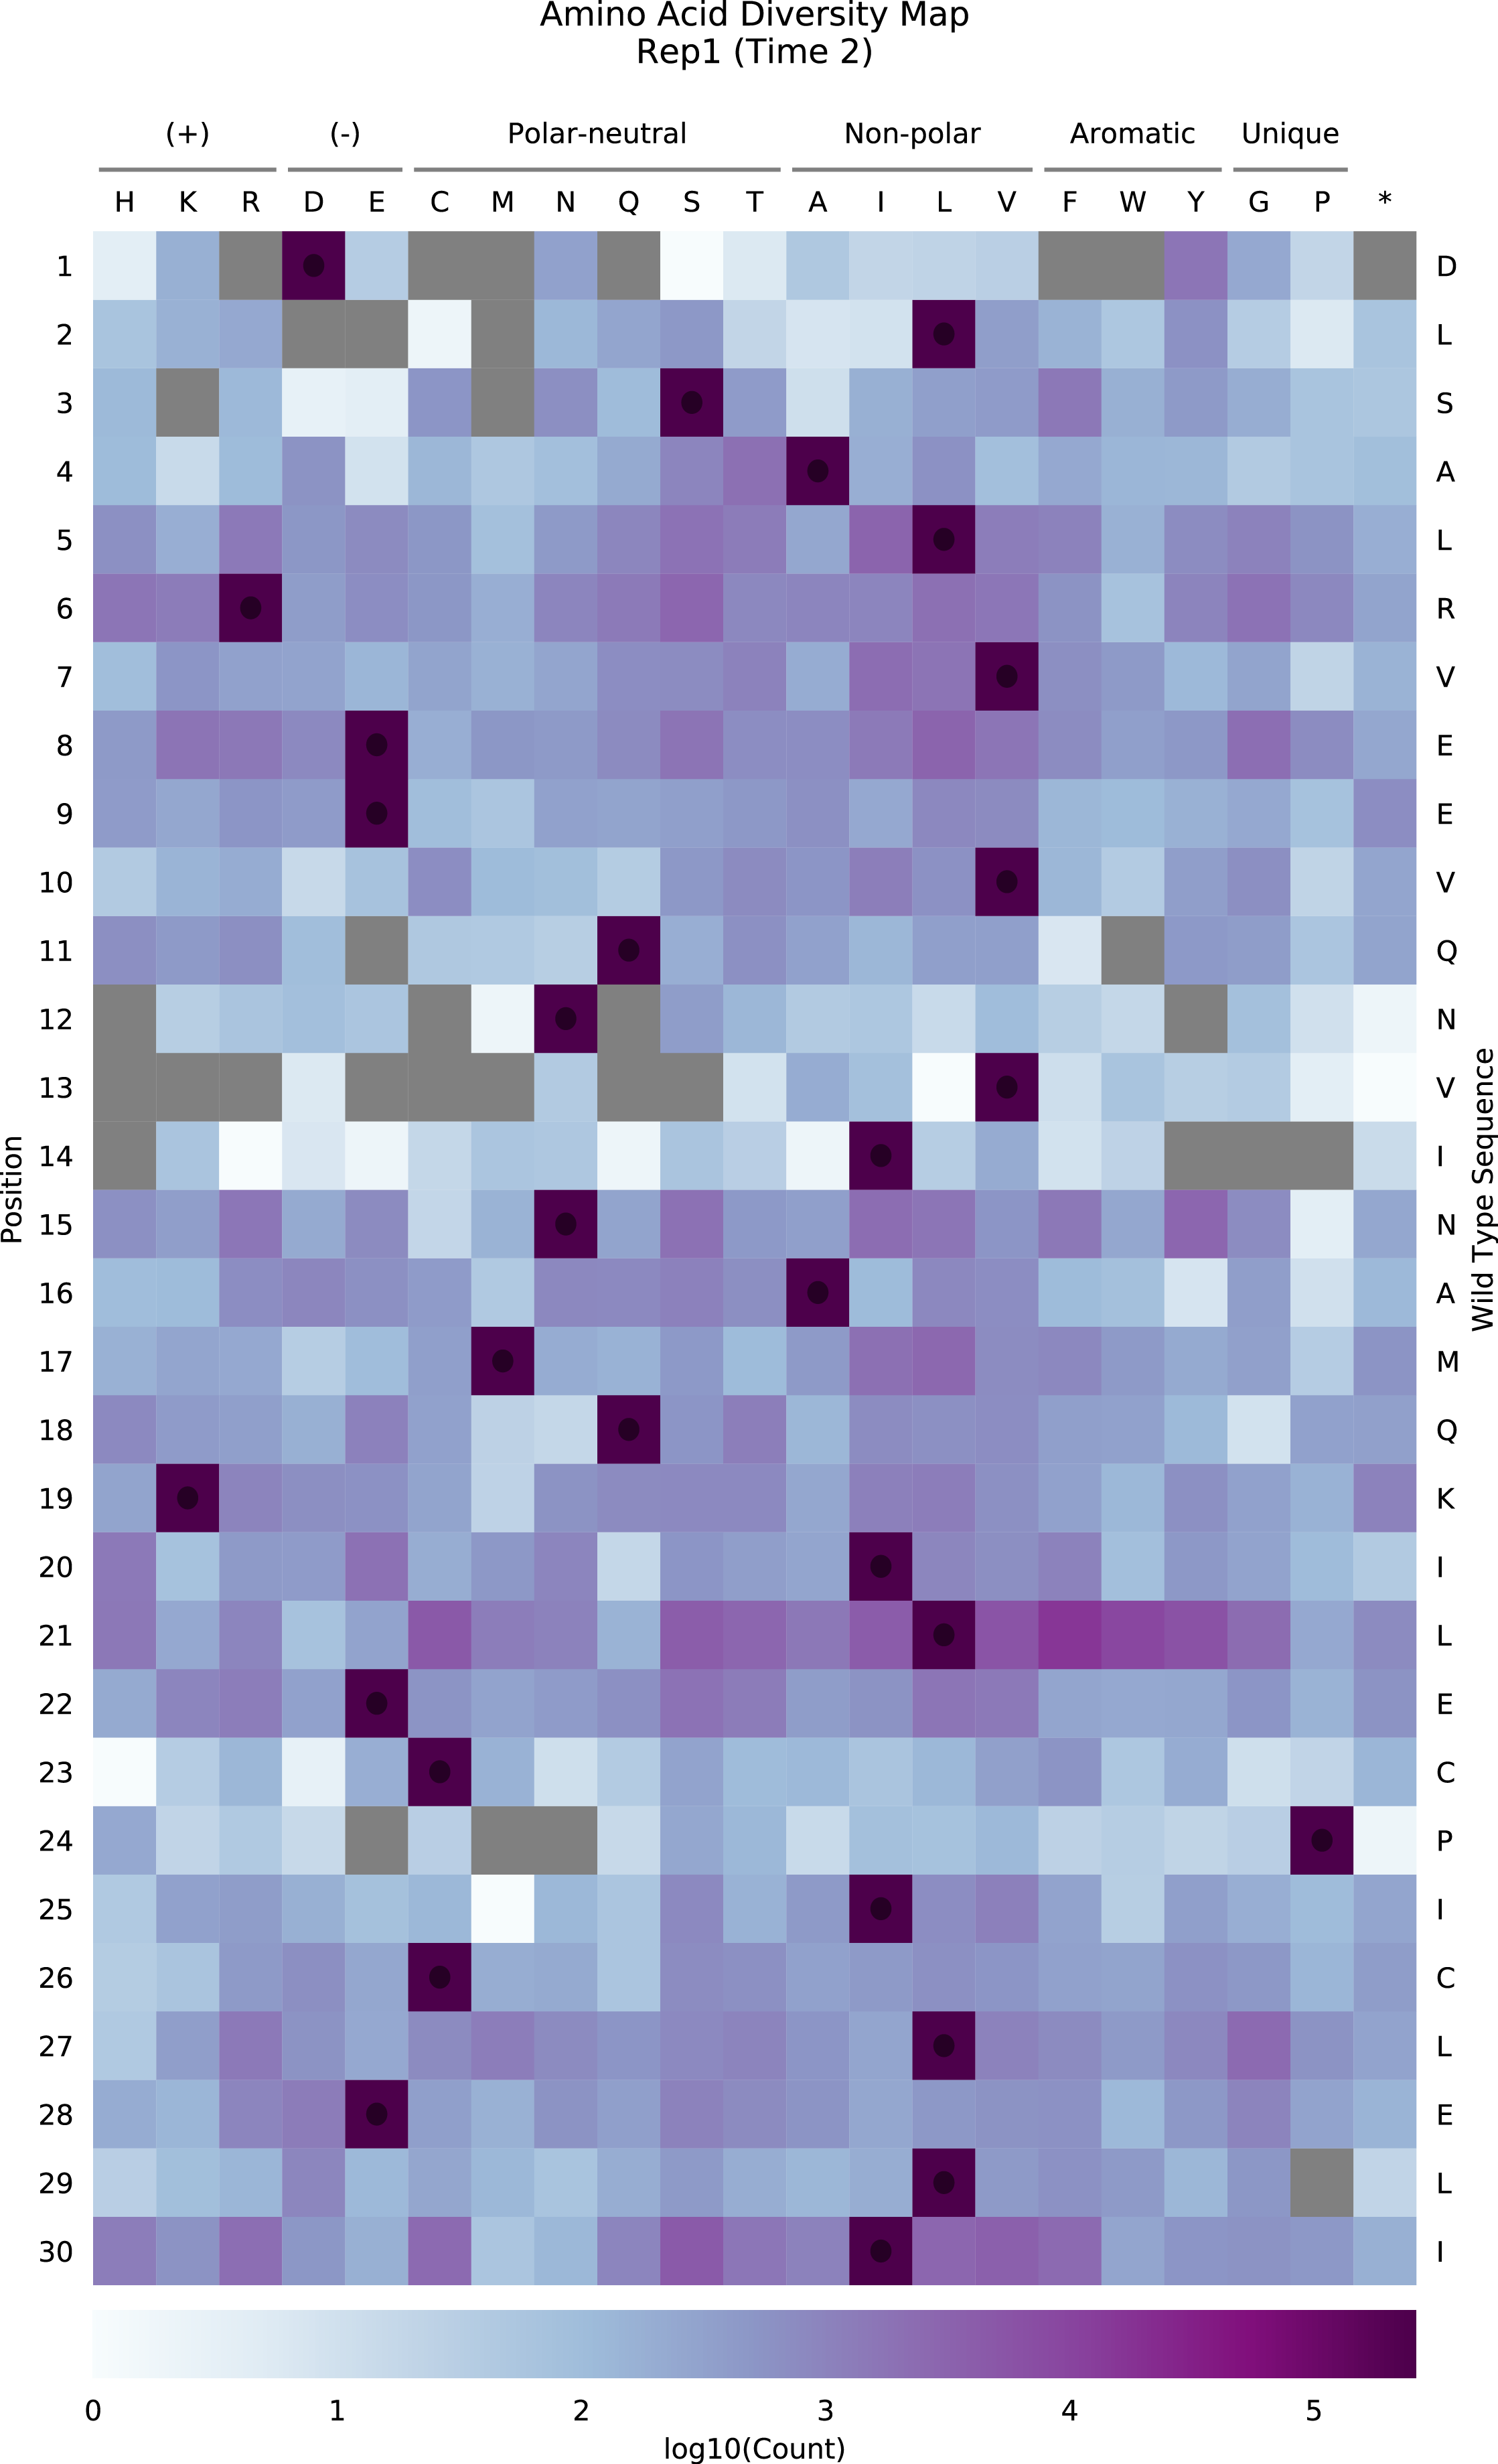
Variant frequencies are visualized in the style of a sequence-function map. Separate protein- and nucleotide-level diversity maps for each time point are generated.
Custom amino acid ordering and groups can be specified by running Enrich2 in command line mode and using the
--sfmap-aa-fileoption. See above for more details.Counts per time point
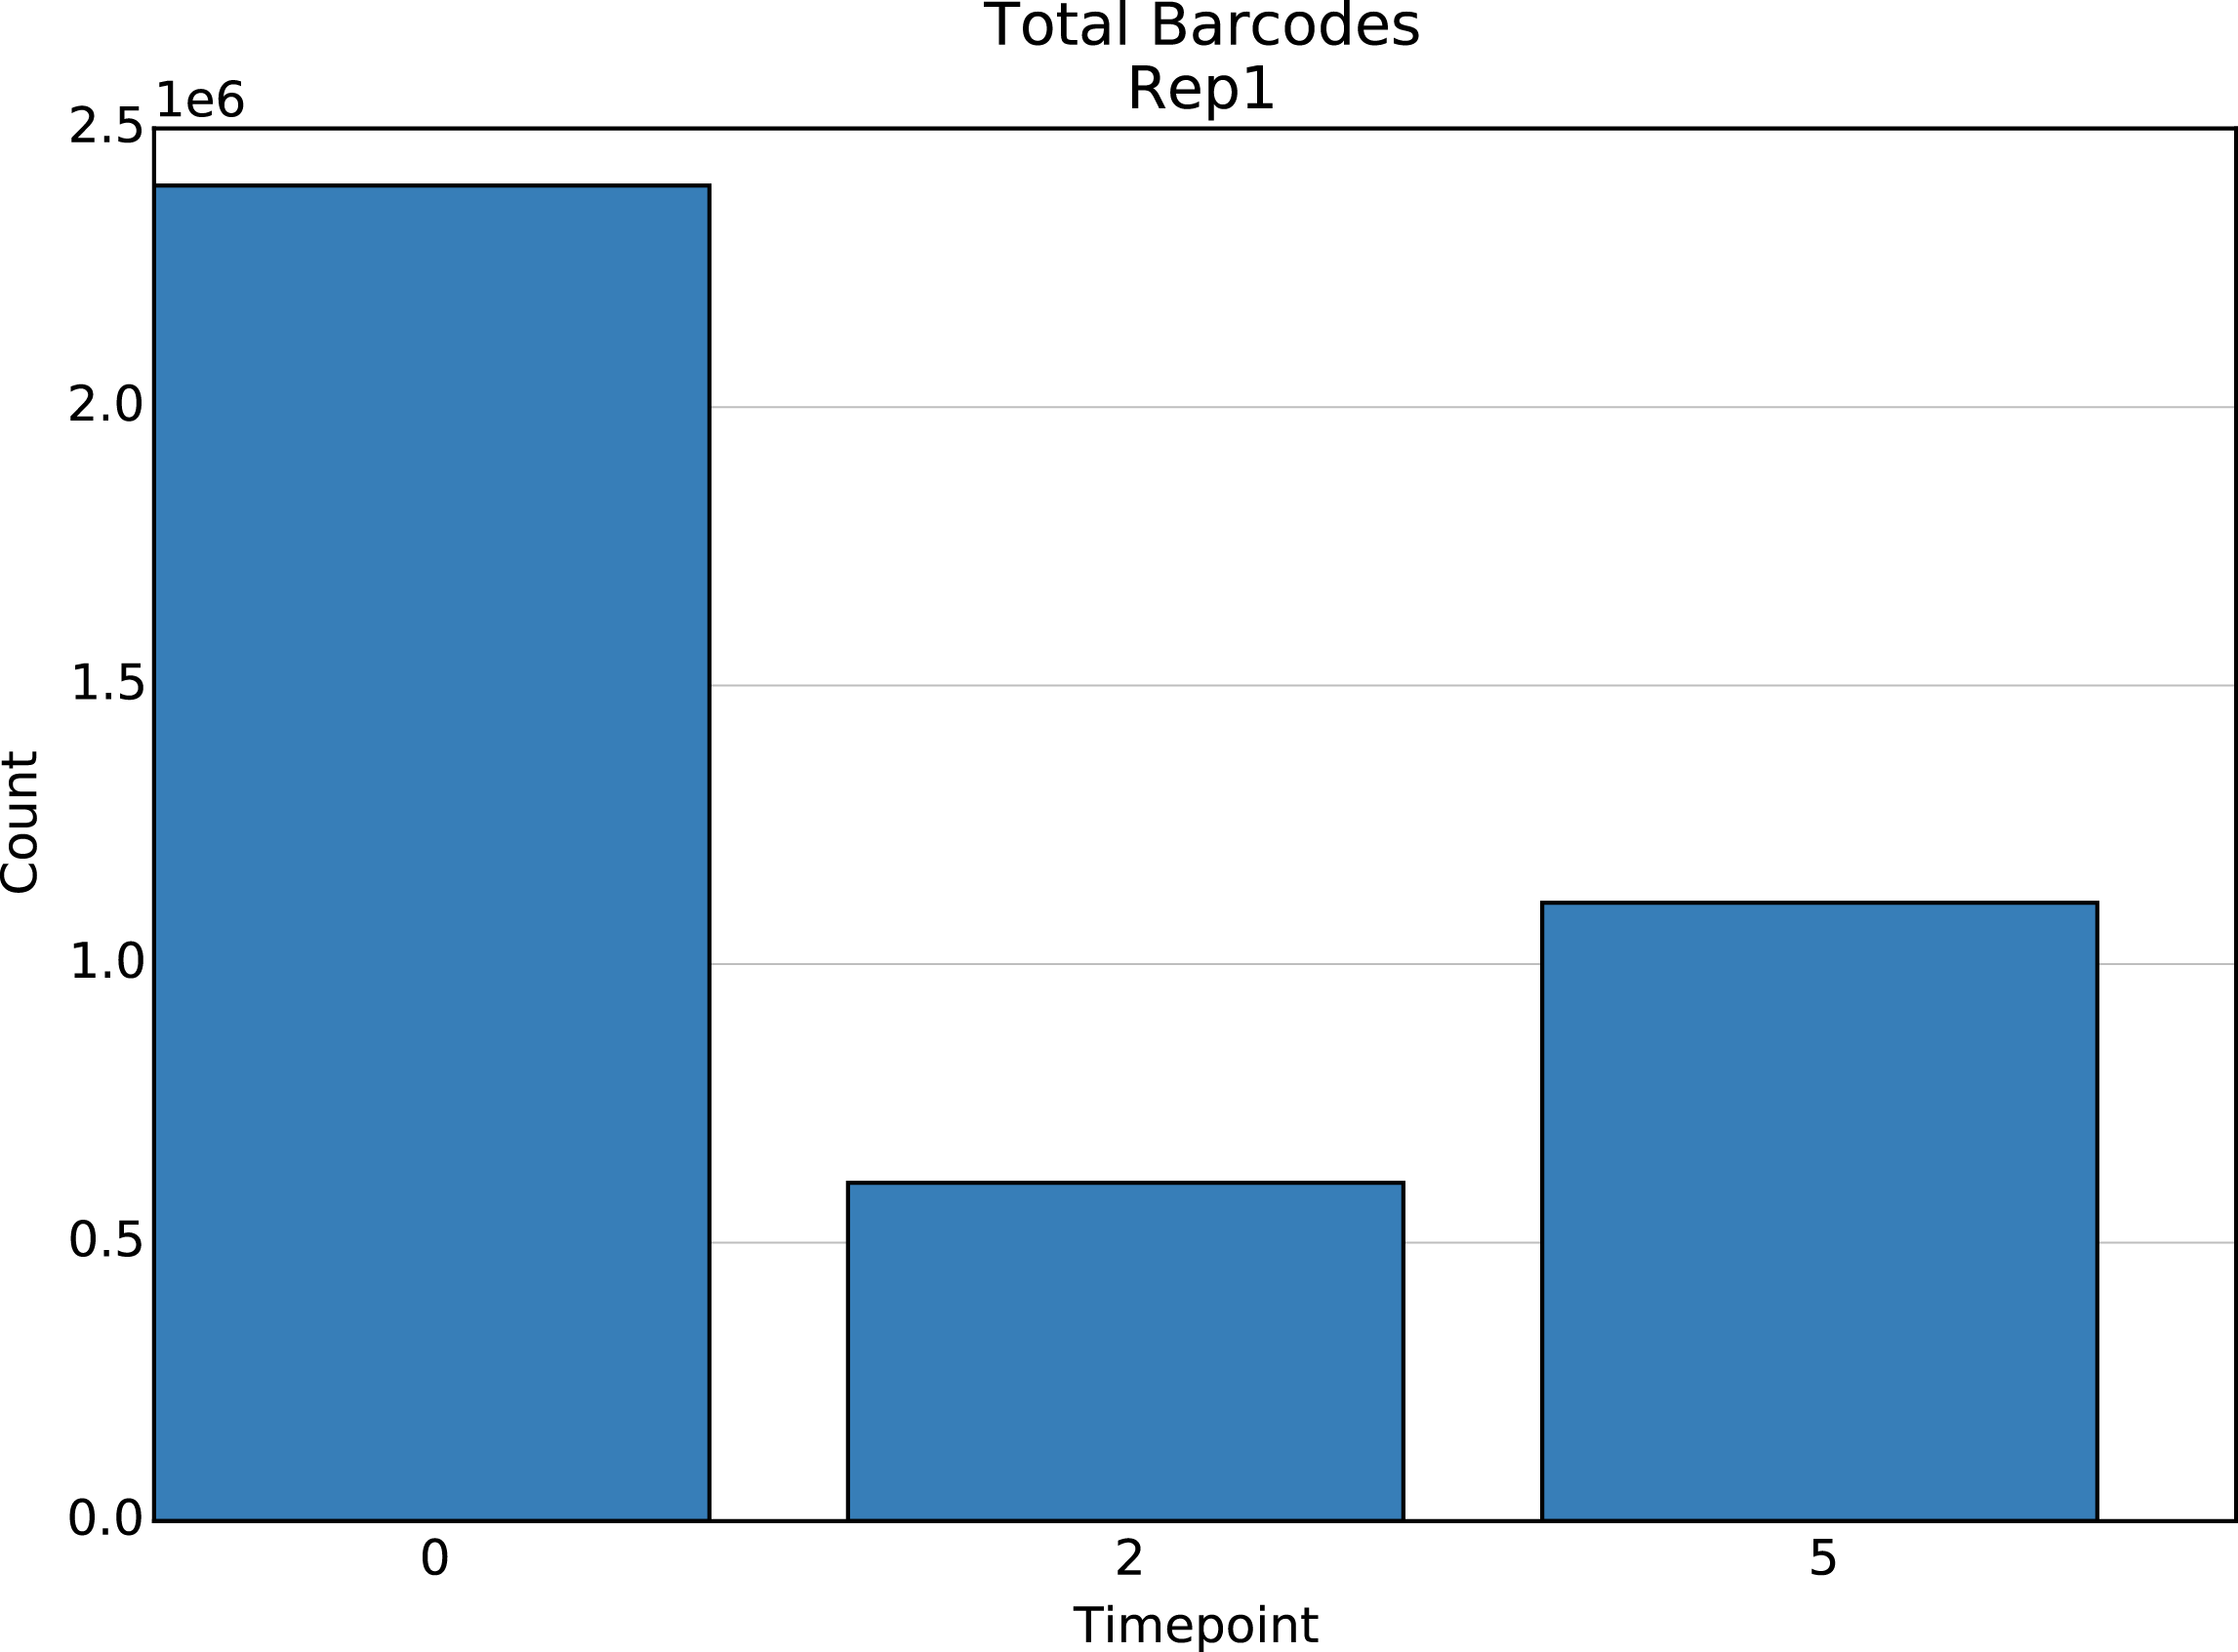
Bar plots showing the total element count in each time point. One plot for each element type.
Representative regression fits
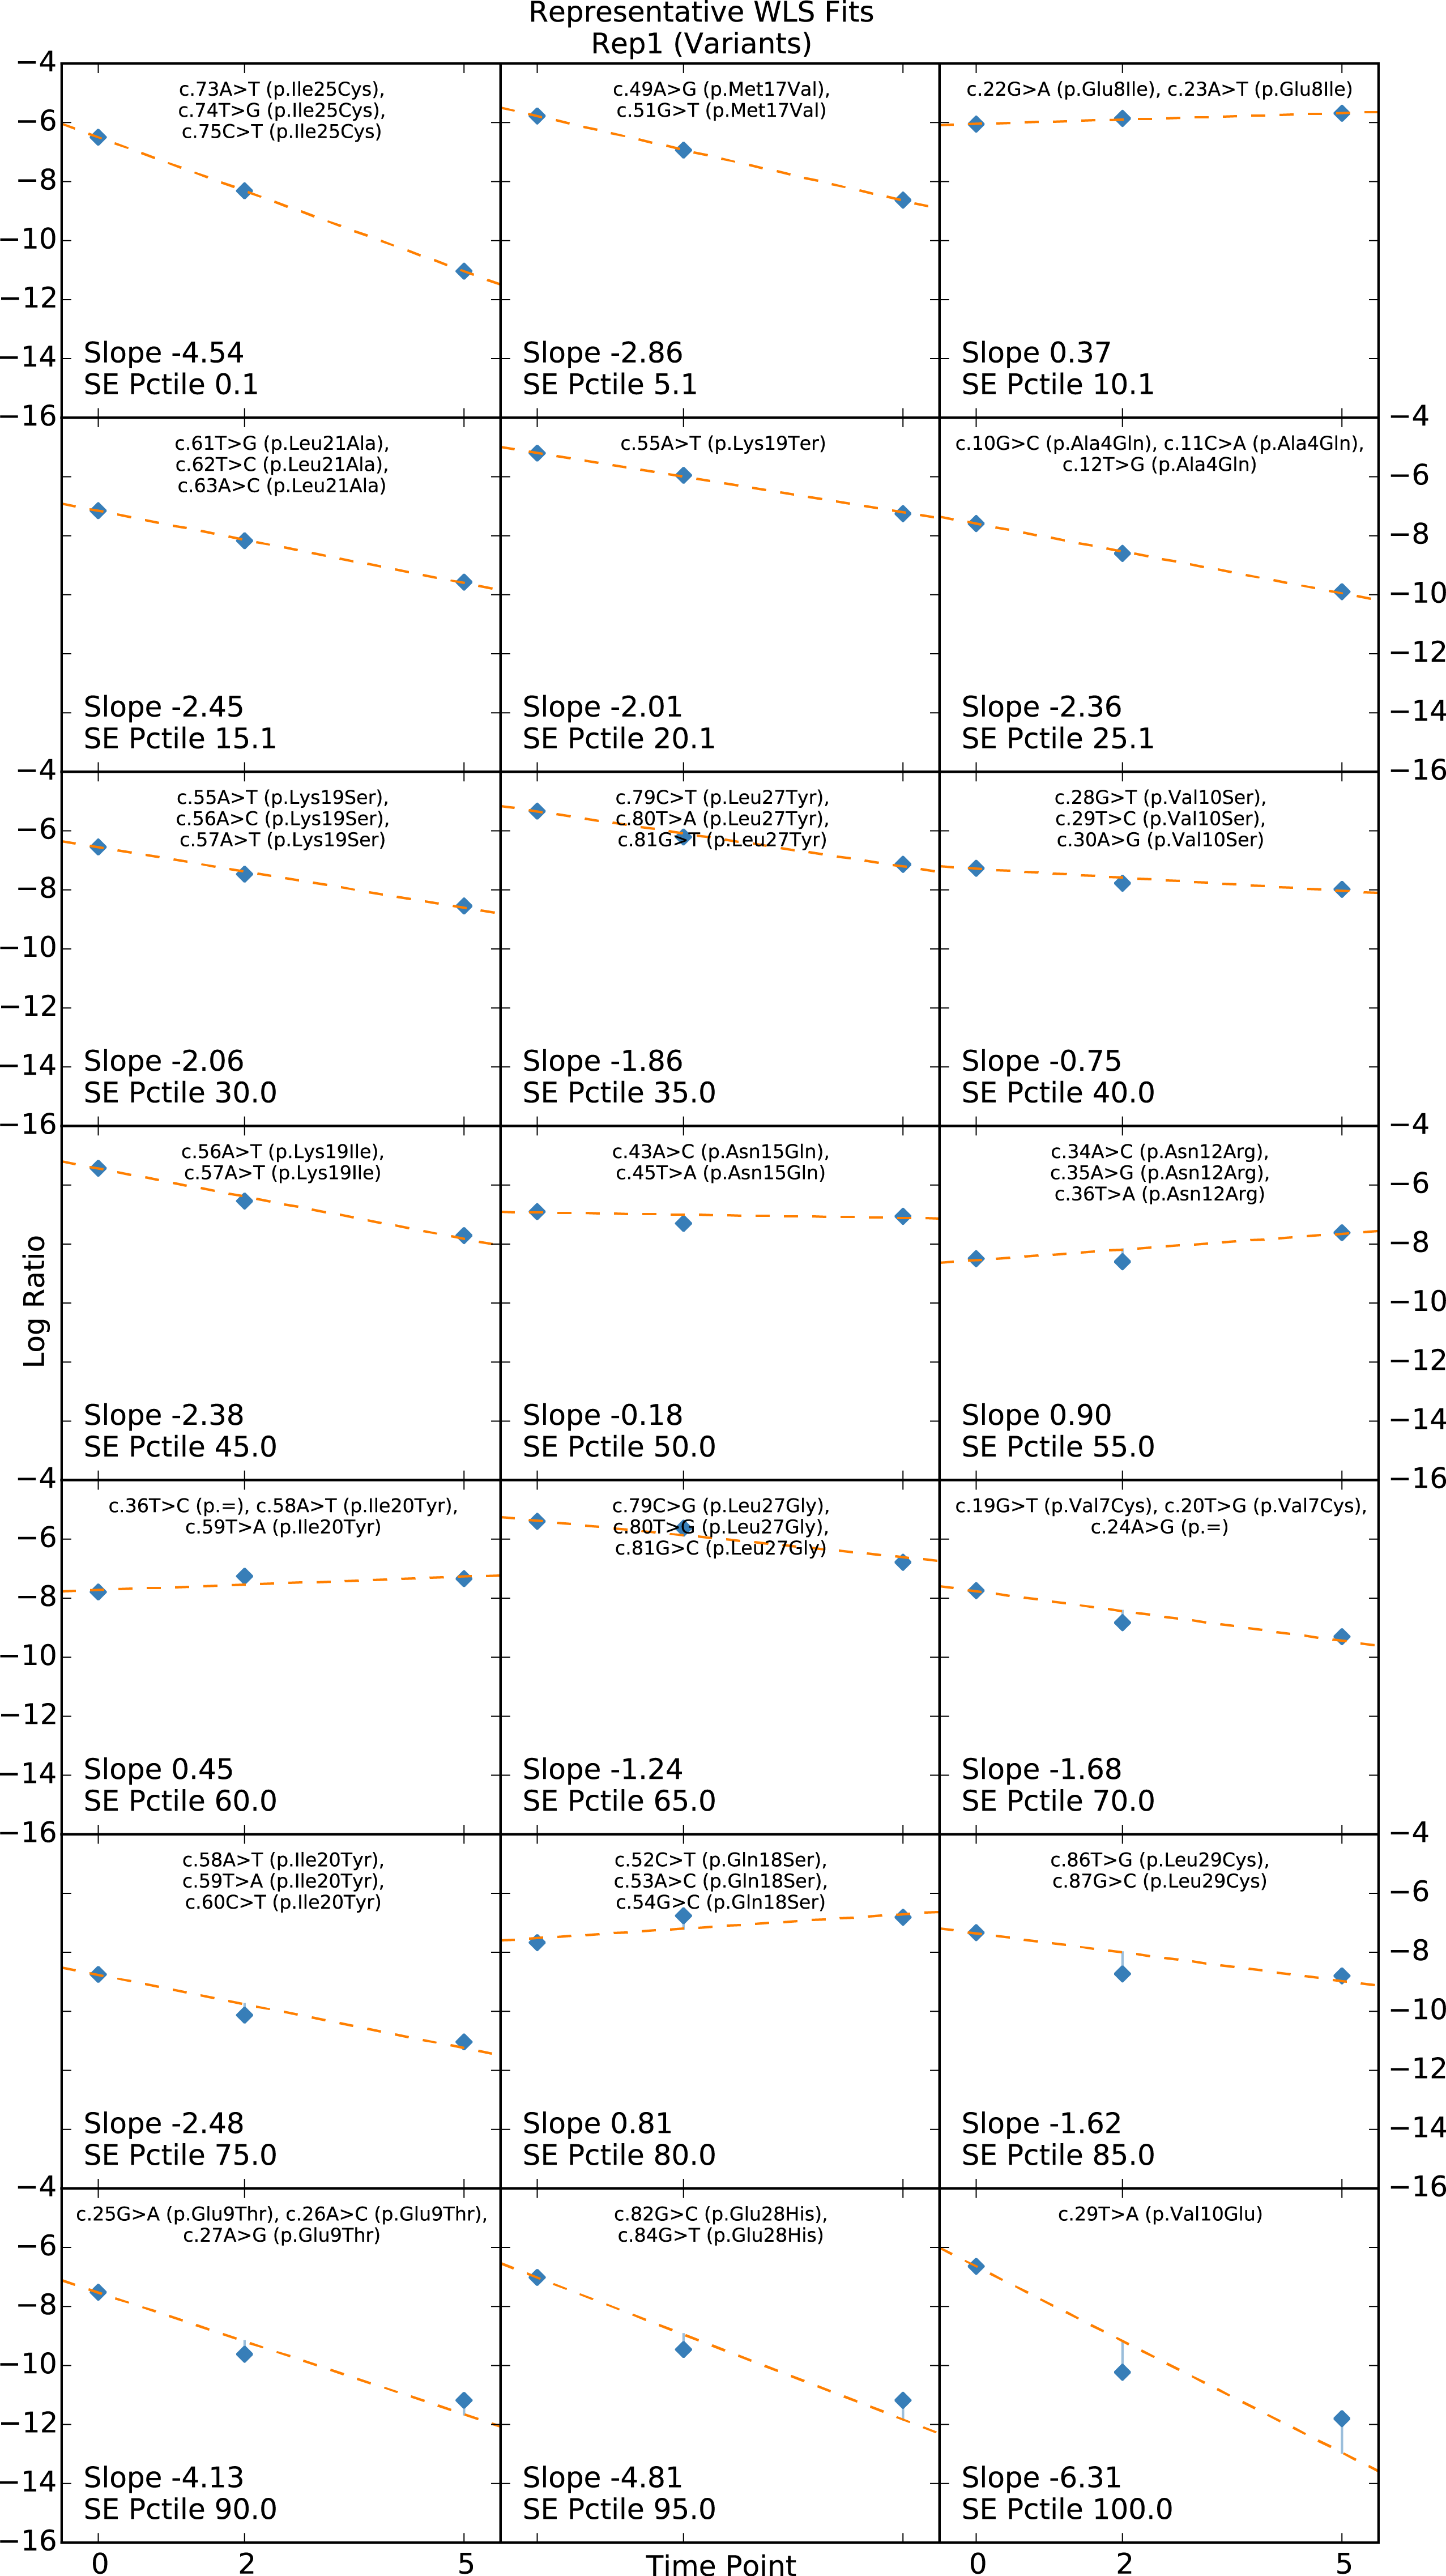
Present for linear regression scoring methods only. Linear fits for the element closest to each 5th percentile (0, 5, 10, ..., 95, 100). Used for diagnostic purposes and setting standard error filtering cutoffs. One plot for each element type.
Regression weights
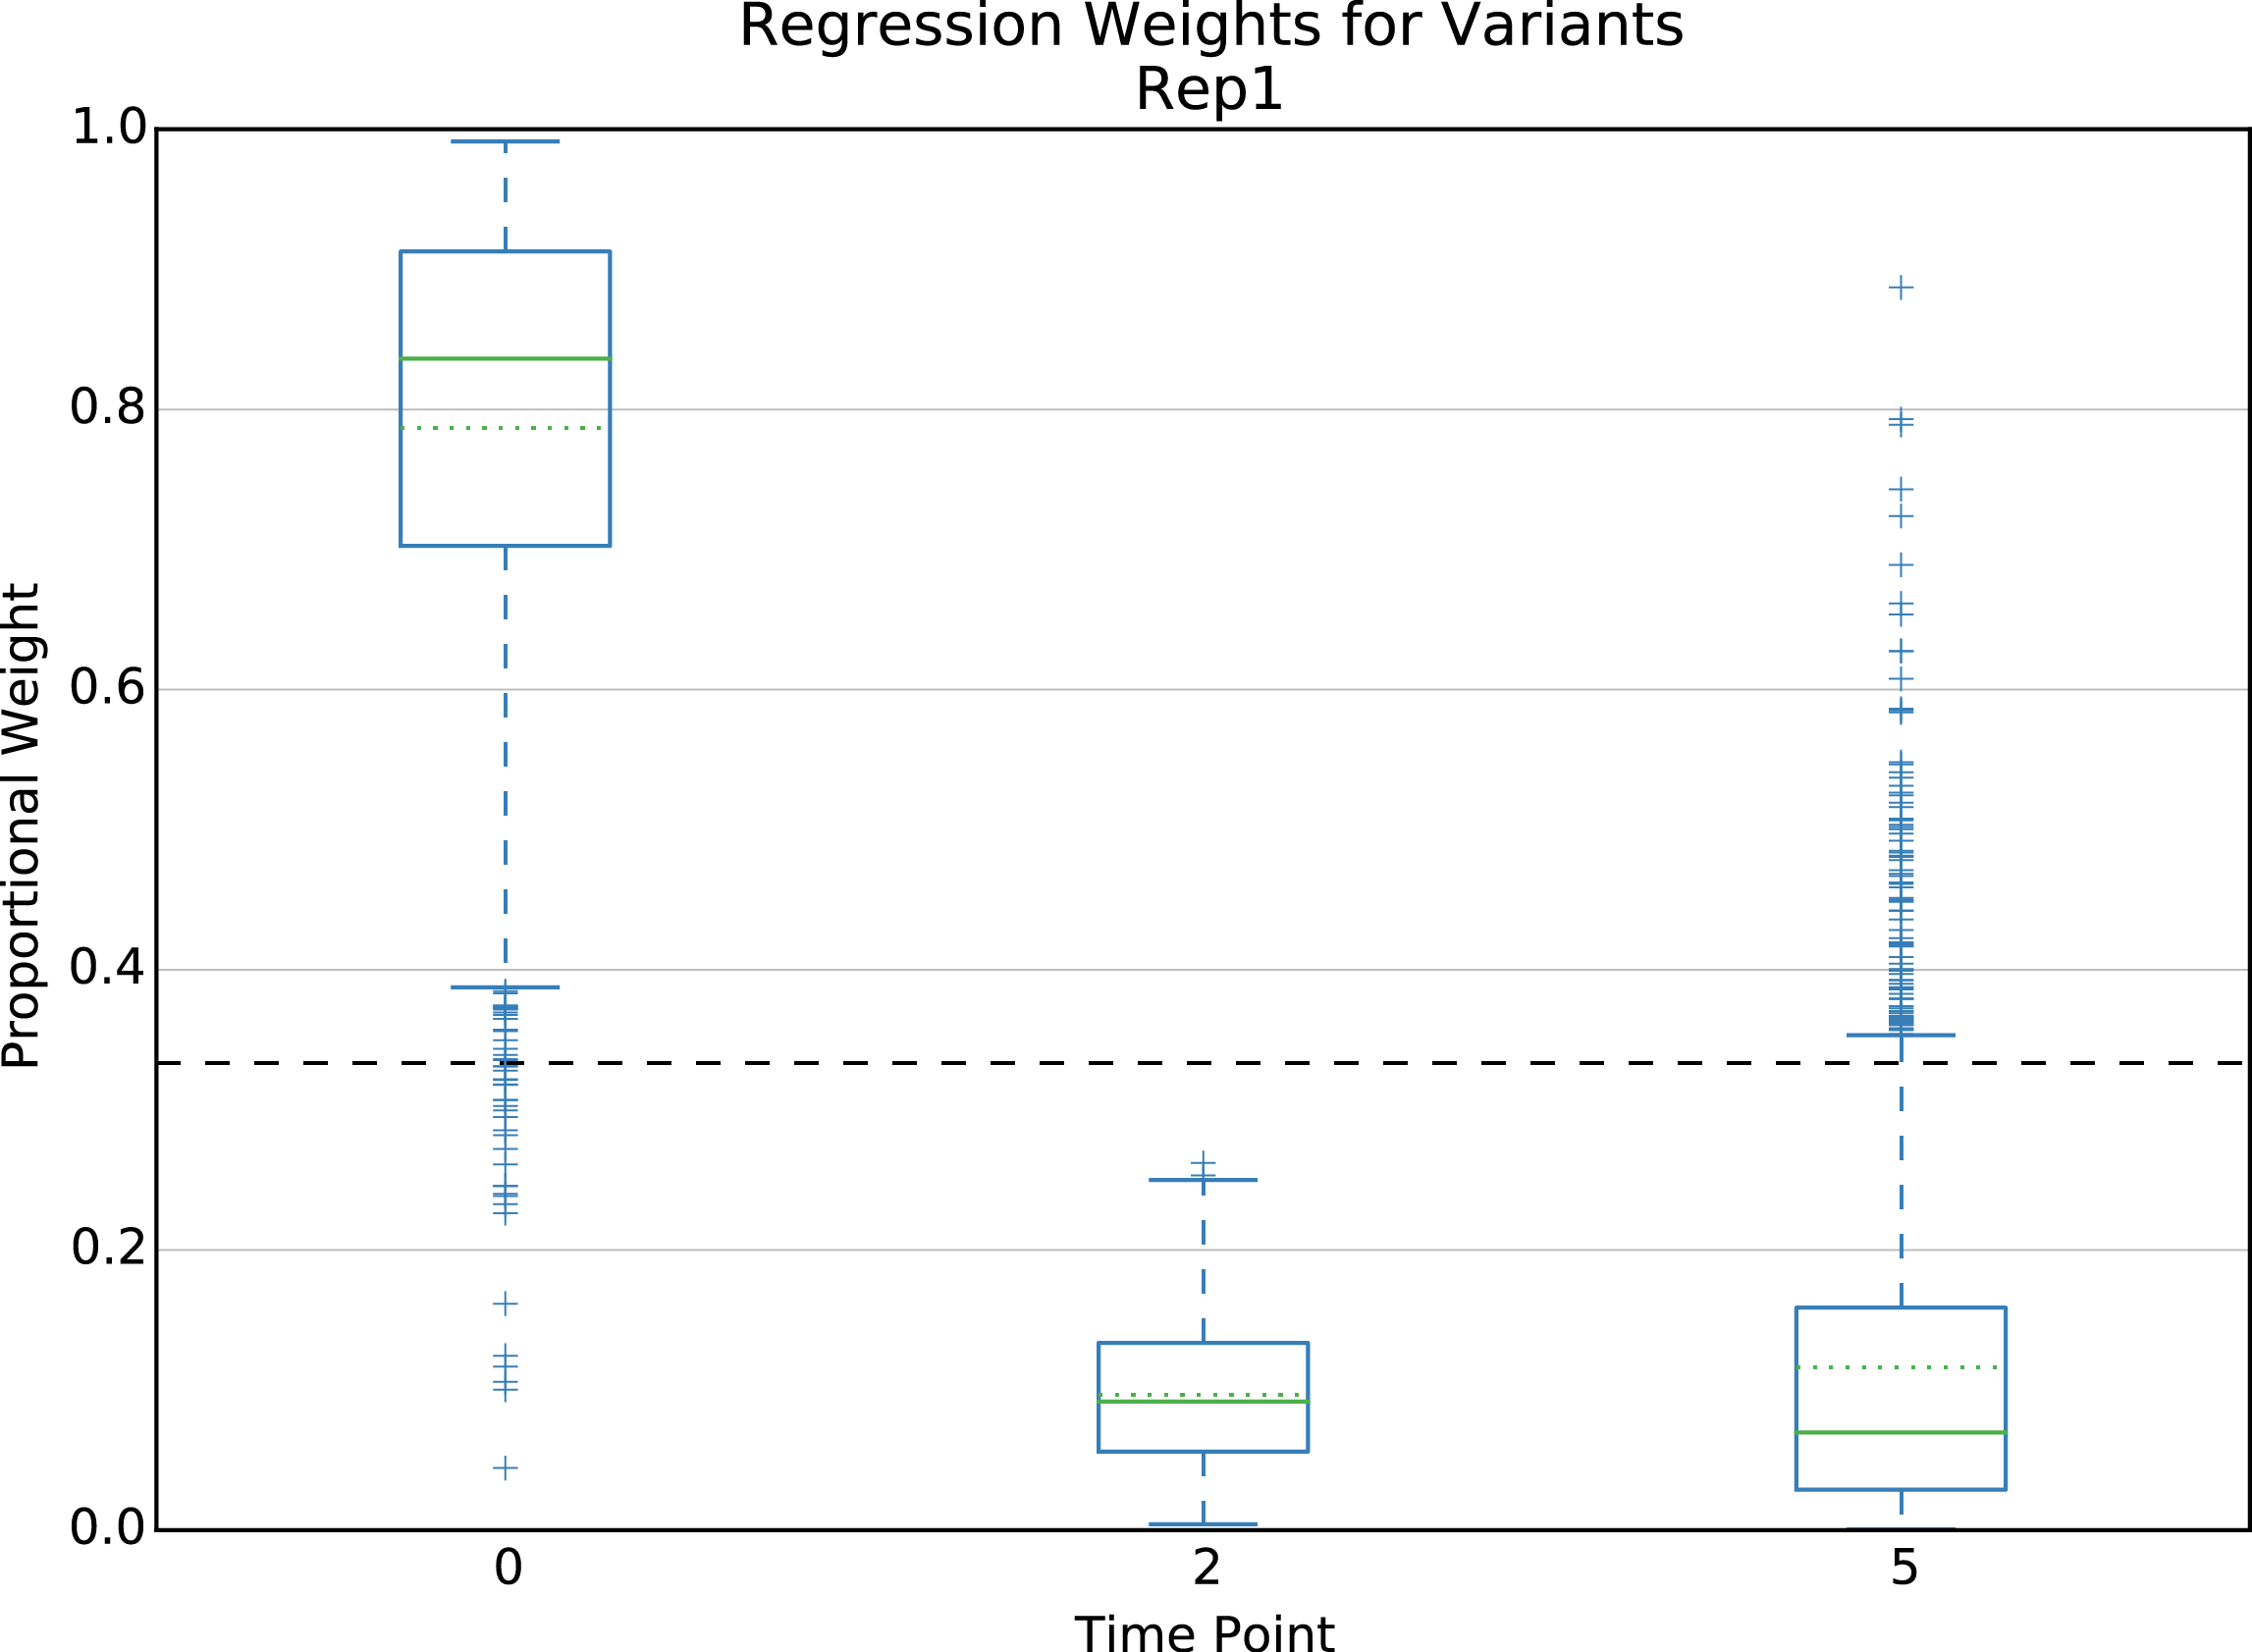
Present for weighted linear regression scoring method only. Boxplot of regression weights for each time point. Dashed line indicates uniform weight. One plot for each element type.
Volcano plot
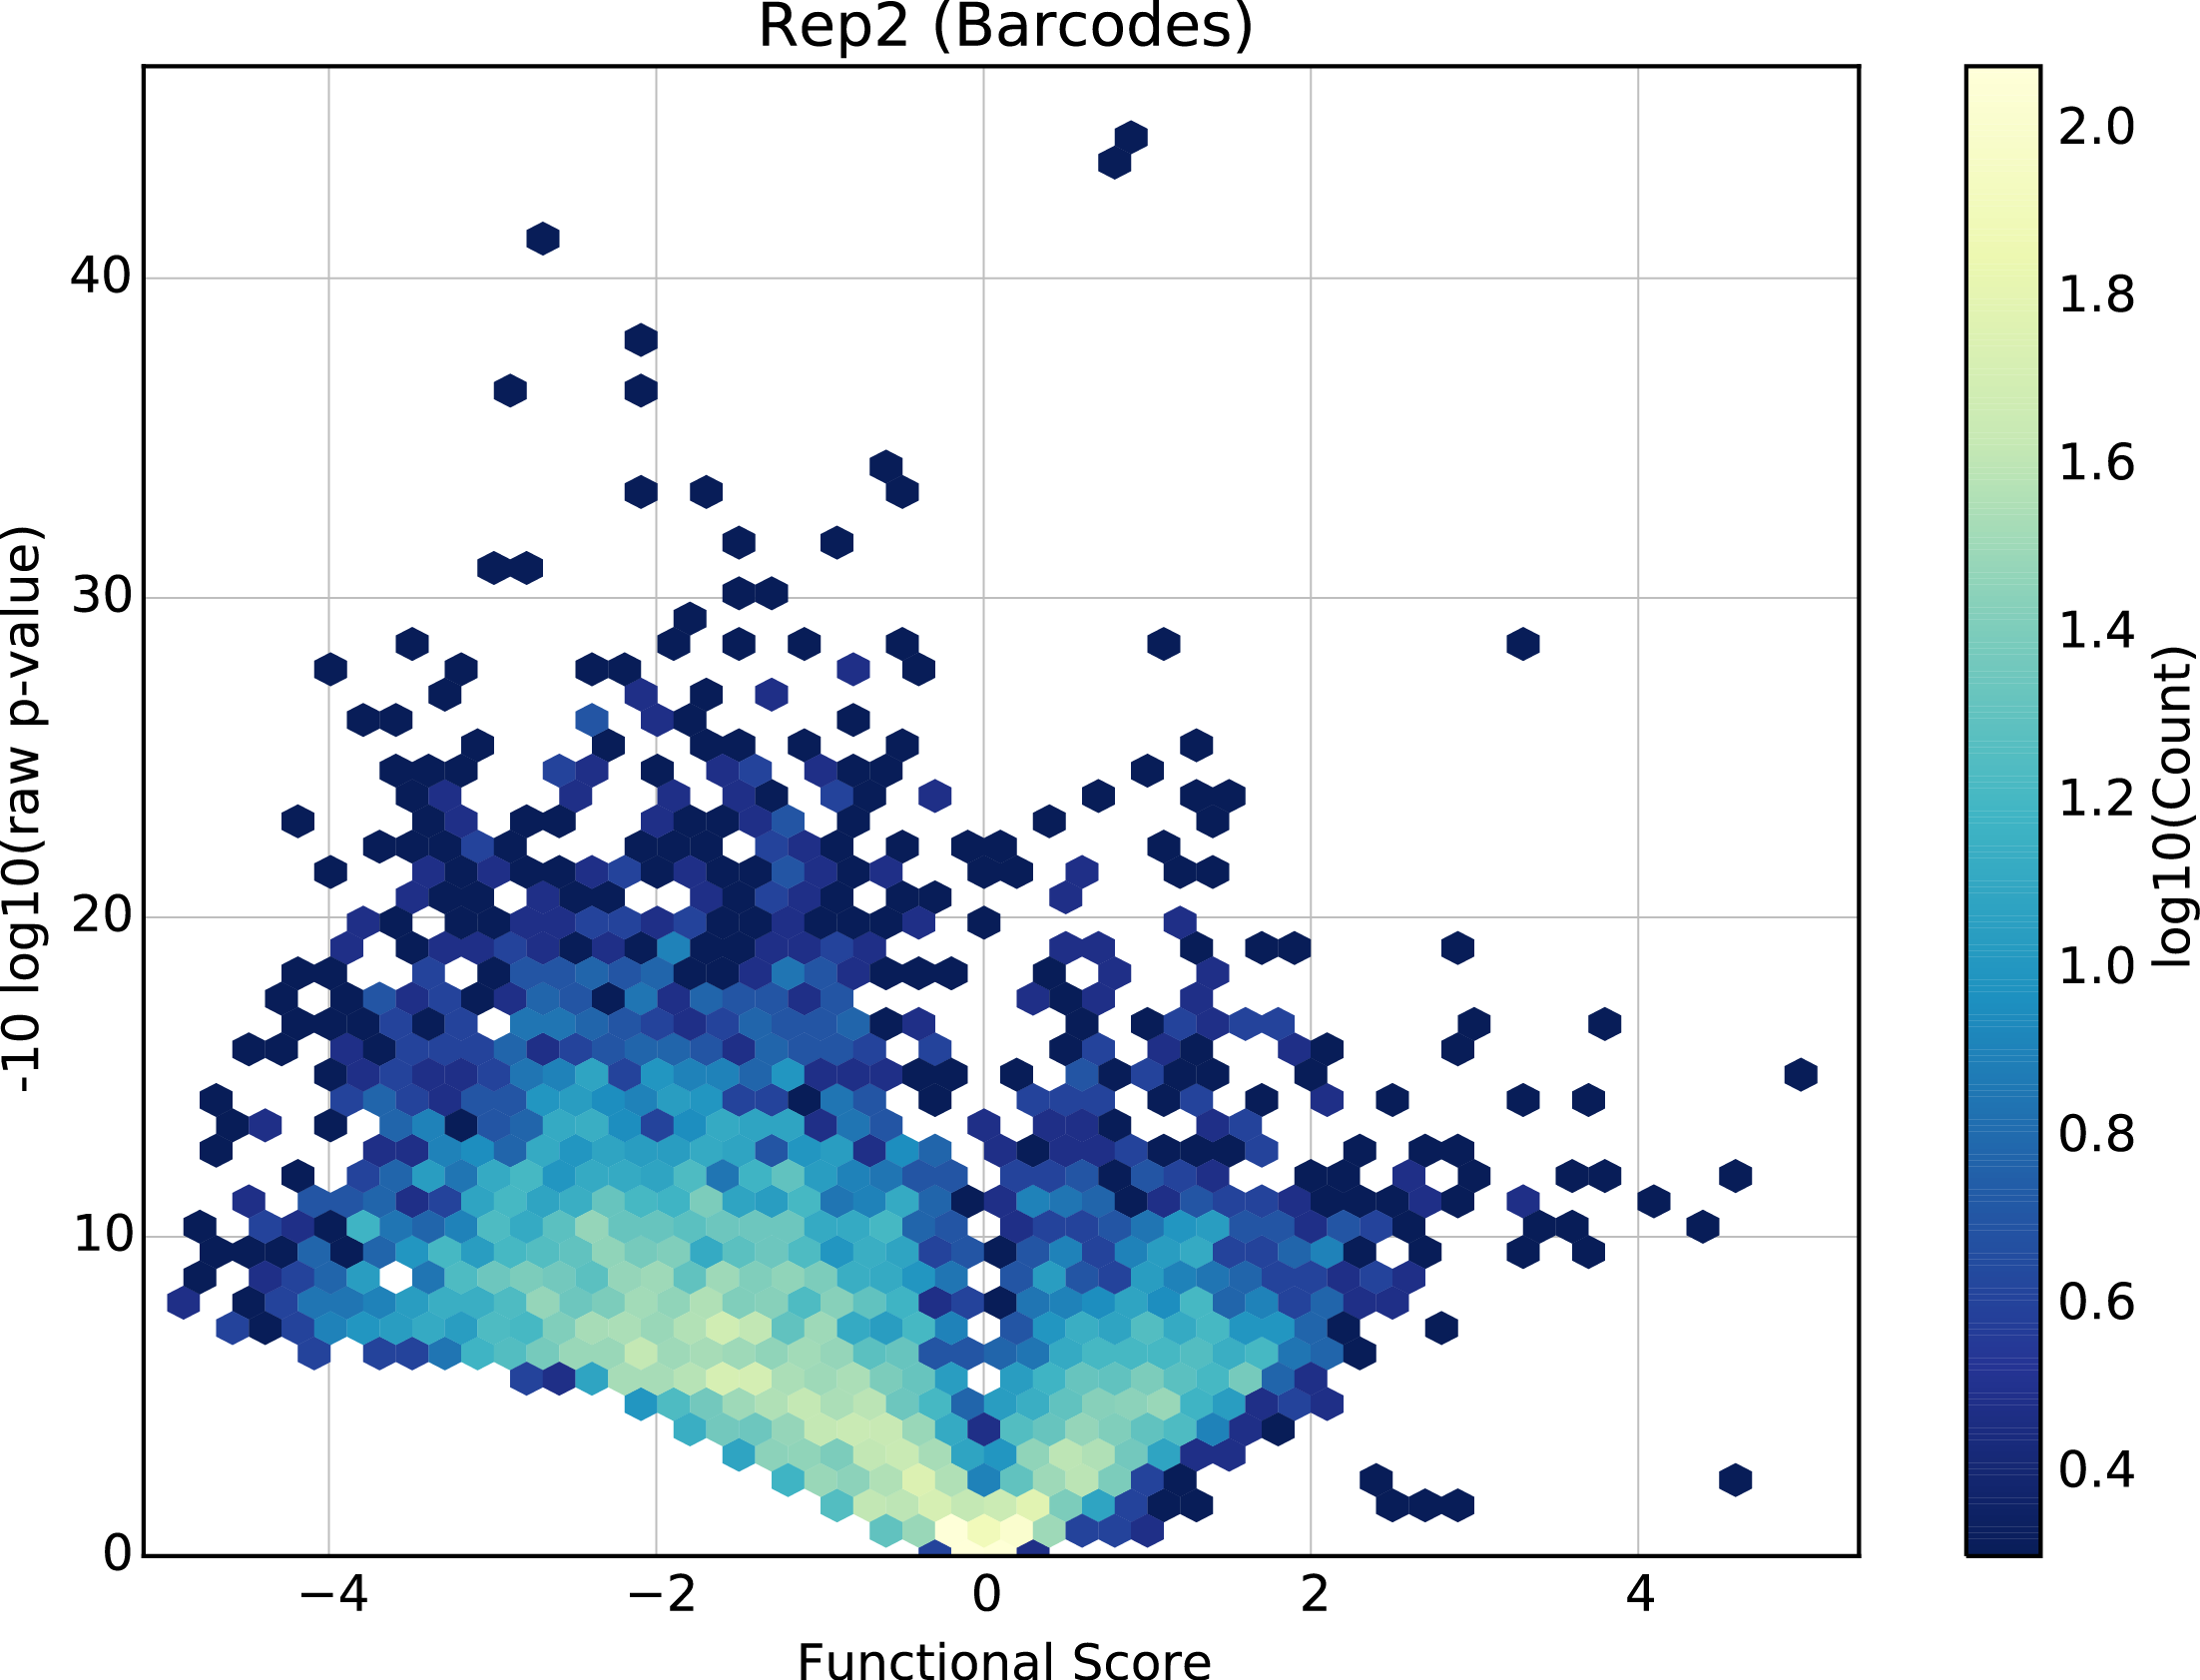
Present for linear regression scoring methods with variants only. Volcano plot of the raw p-value from a z-test under the null hypothesis that the element behaves the same as wild type vs. the element’s score. One plot for each element type.
Wild type shape
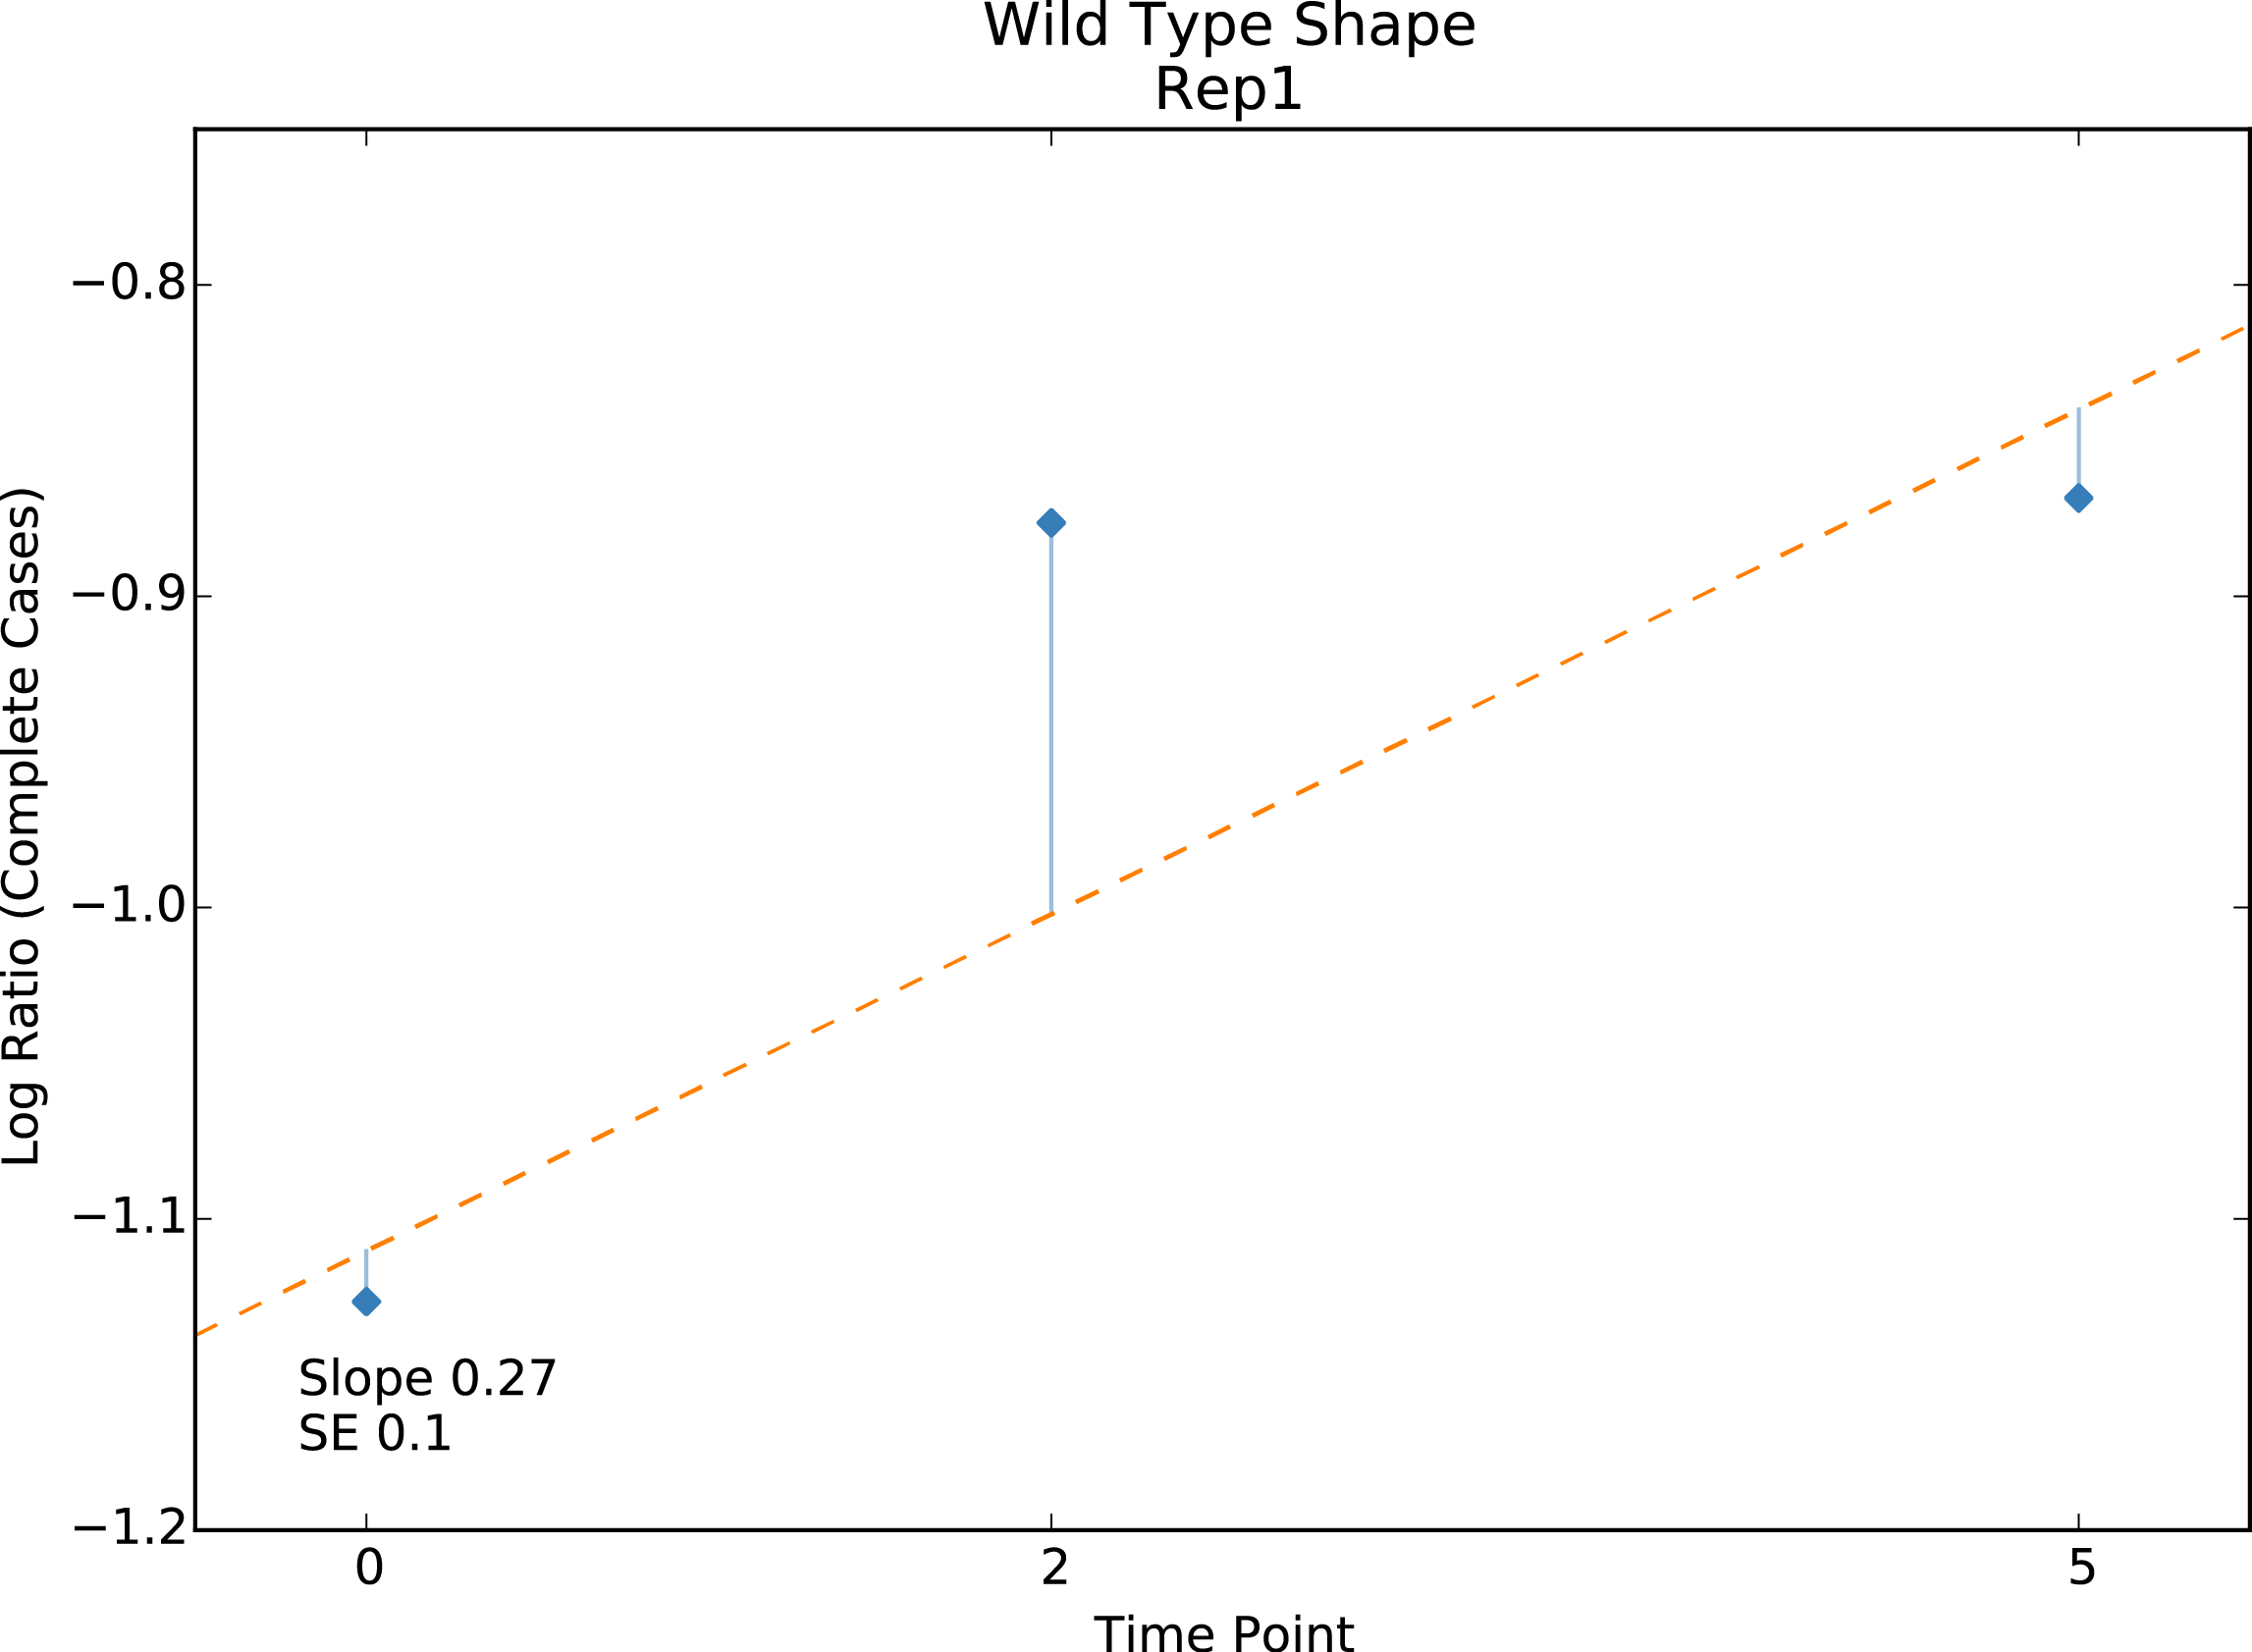
Present for linear regression scoring methods with variants only. Plot of the non-normalized linear fit of the wild type. Used to assess the effect of wild type correction.
SeqLib plots
Counts per element
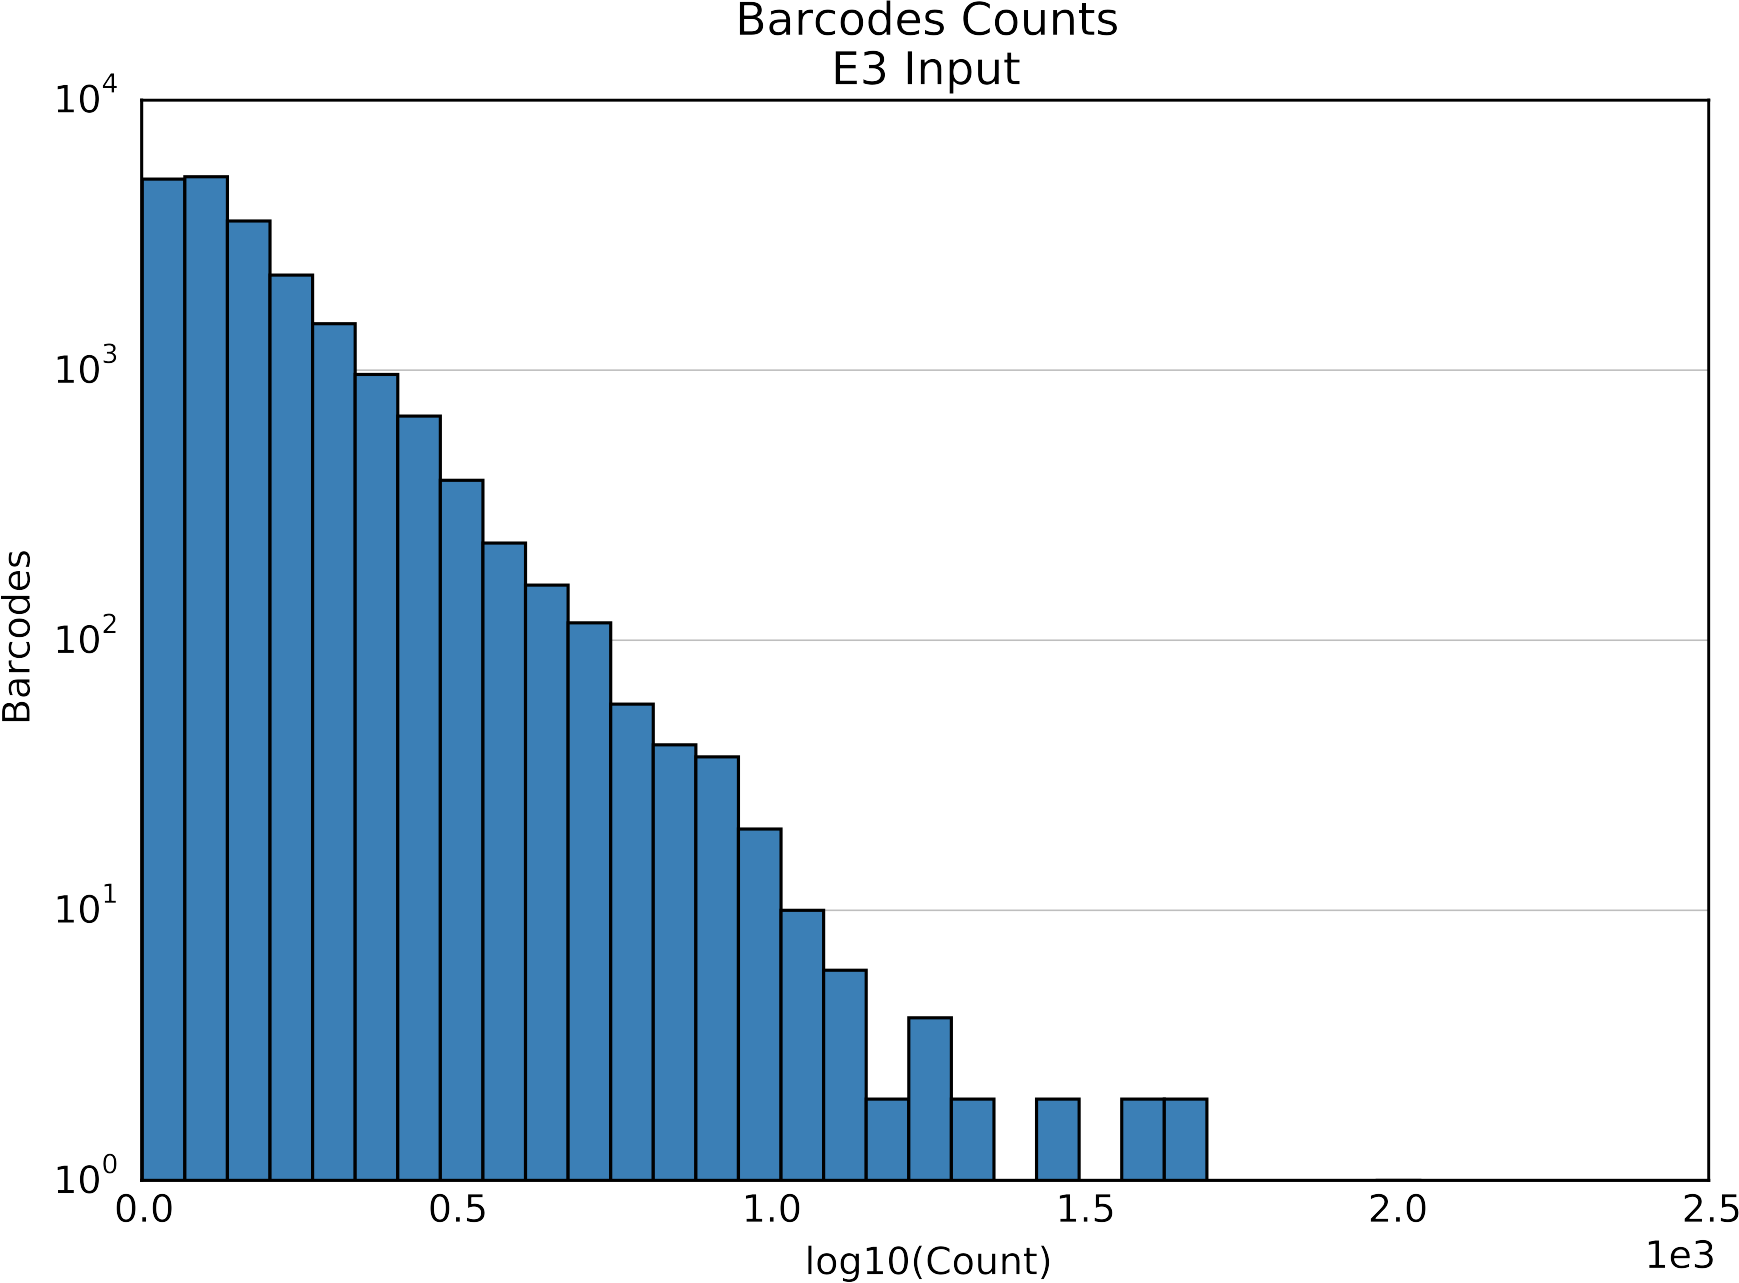
Histogram of element counts. Two plots for each element type, one with log-transformed x-axis and one without.
Unique barcodes per element
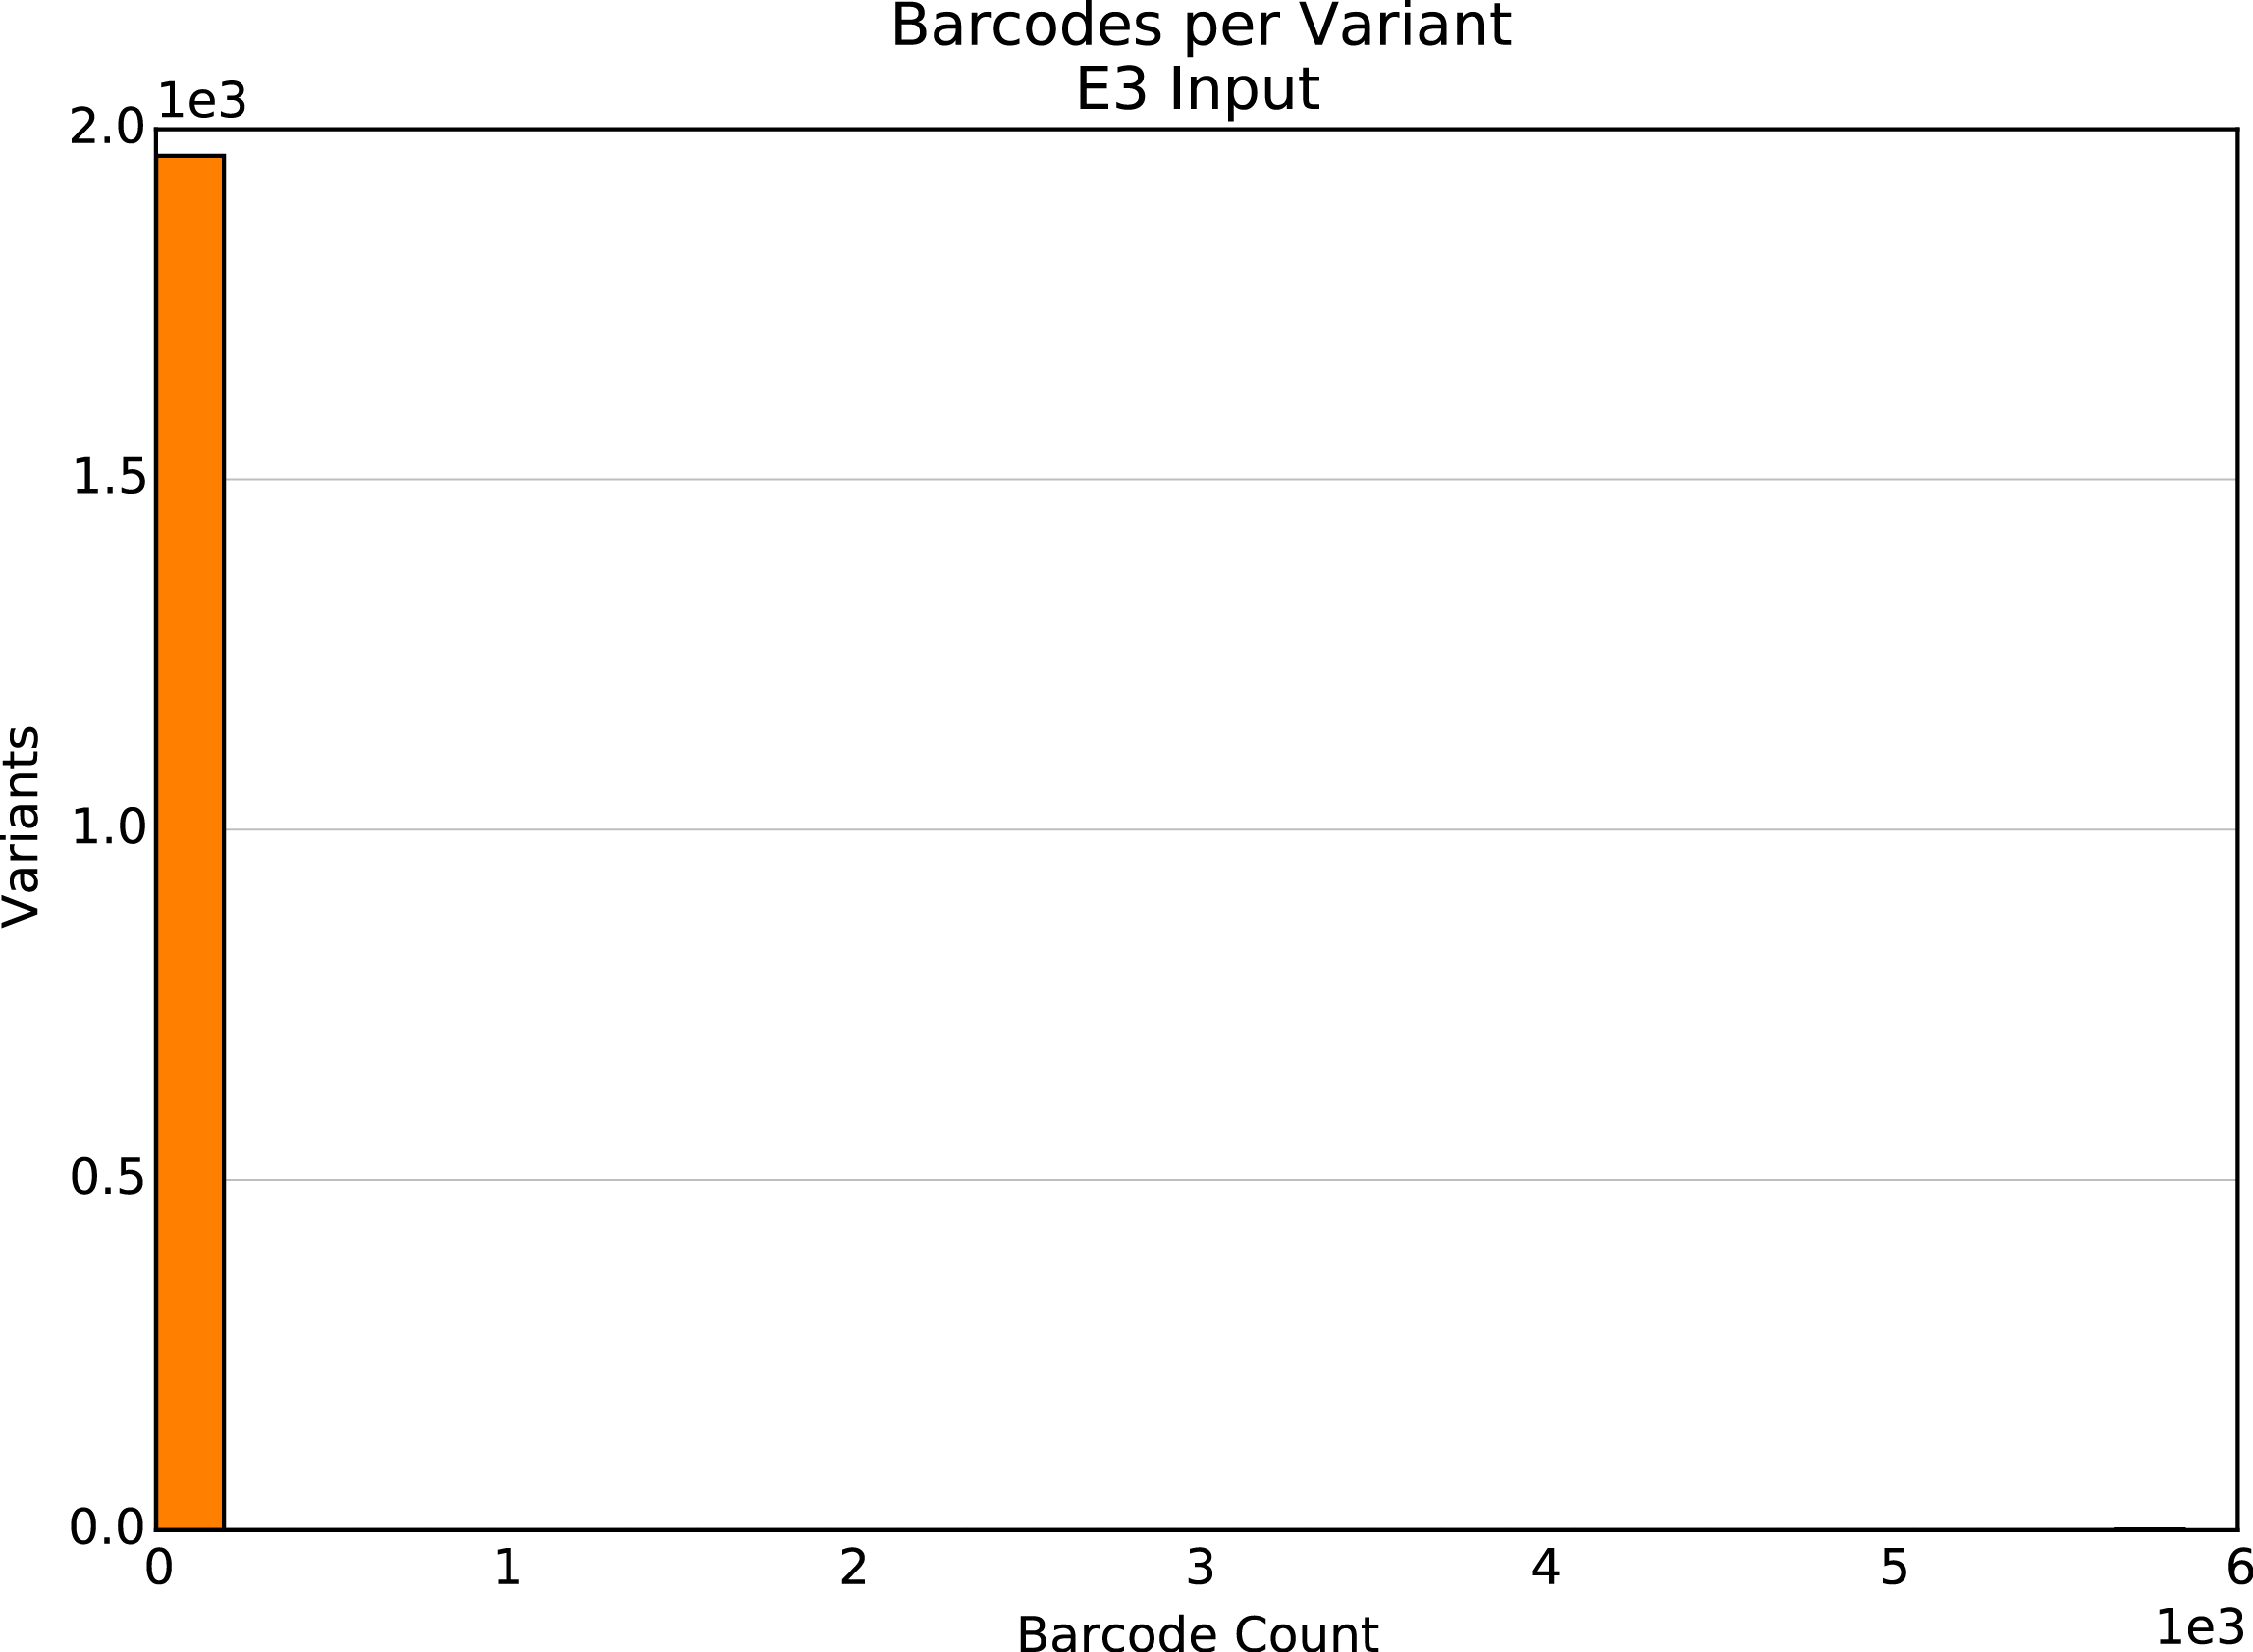
Present for Barcoded Variant and Barcoded Identifier SeqLibs only. Histogram of unique barcodes per variant or identifier.
Mismatches in overlapping reads
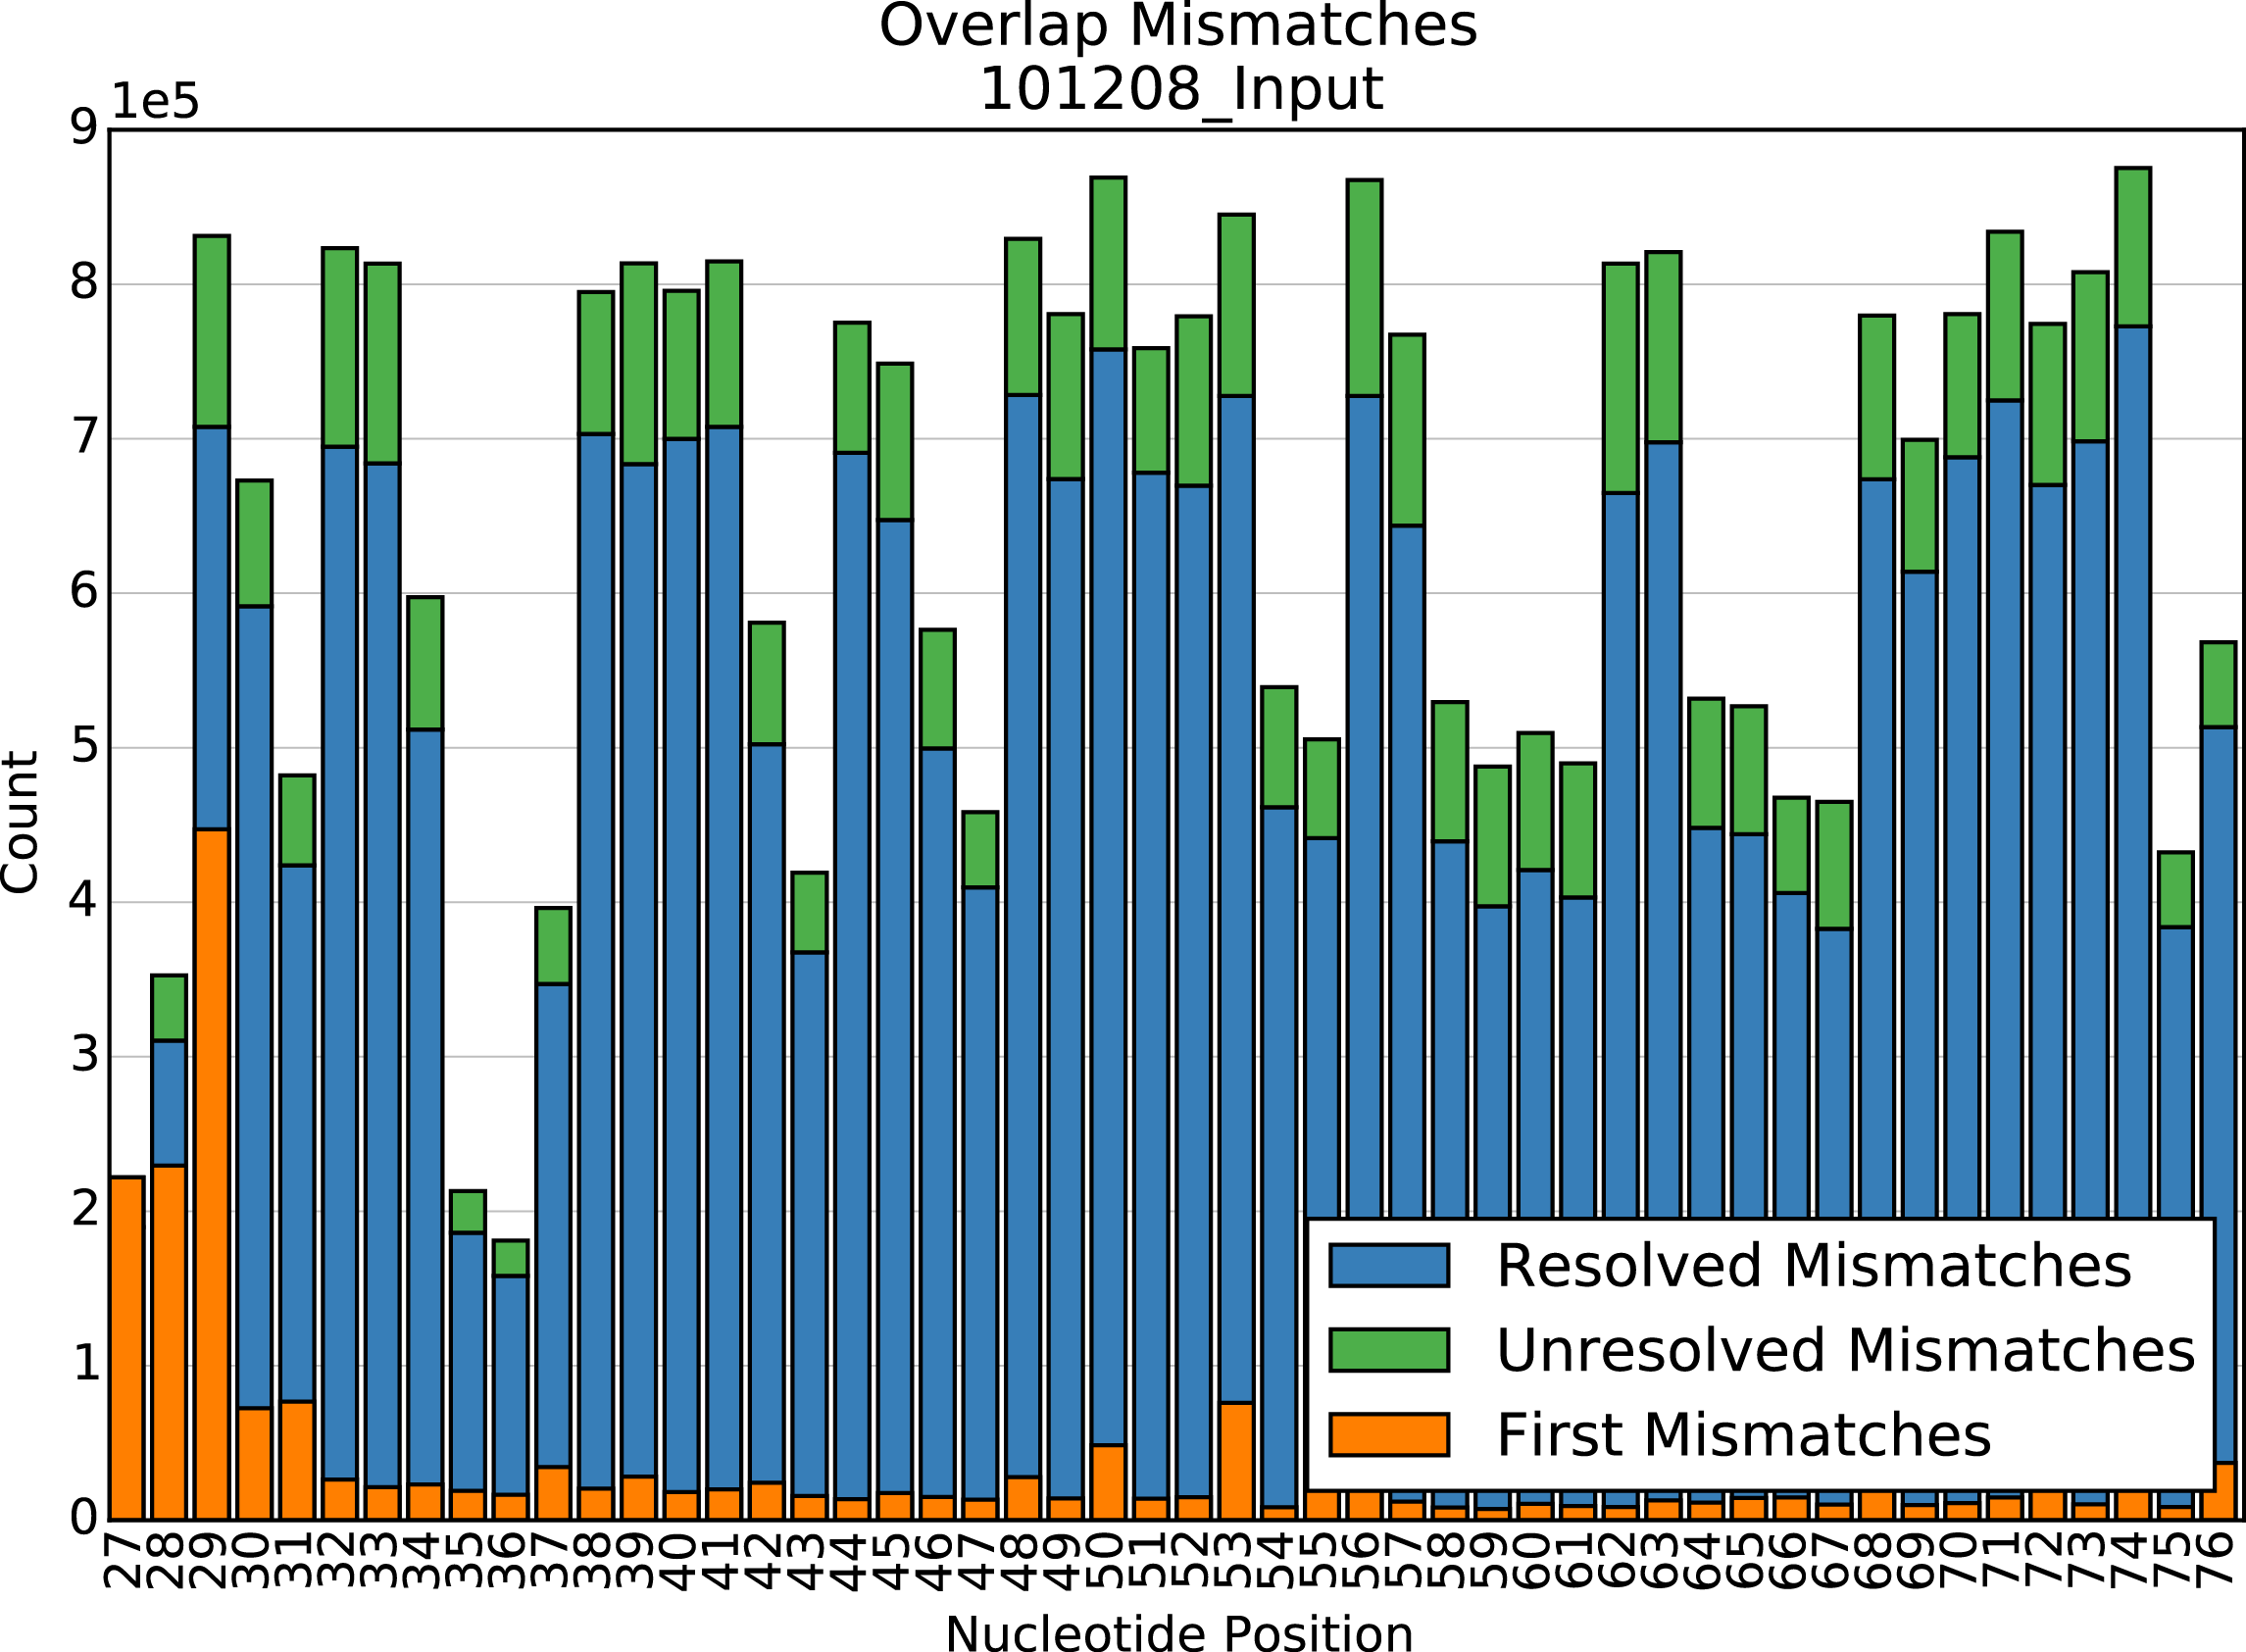
Present for Overlap SeqLibs only. Barplot of the number of resolved and unresolved mismatches at each position in the overlap region, and the number of times the first mismatch in a read pair occured at each position. Used for diagnosing misalignment of overlapping reads.